
GNU Radio AM Modulation and Demodulation on PlutoSky P1
A hands-on AM-DSB-TC tutorial: simulate modulation and envelope detection in GNU Radio, then transmit and receive audio at 500 MHz with PlutoSky P1.

This tutorial guides you through a conventional AM (AM-DSB-TC) experiment using GNU Radio. It starts with theory and flowgraph simulation, then covers envelope detection, over-the-air transmission of an audio file, reception, and verification using SDRSharp. Key parameters and acceptance criteria are also provided.
Overview
This tutorial is organized into six parts.
- Experiment preparation and GNU Radio file checklist
- AM-DSB-TC theory and parameter constraints
- Conventional AM modulation simulation
- Conventional AM non-coherent demodulation simulation
- AM audio transmission using PlutoSky P1
- AM audio reception and demodulation using PlutoSky P1
Experiment Preparation and File Structure
Hardware Checklist
| Item | Requirements and Notes |
|---|---|
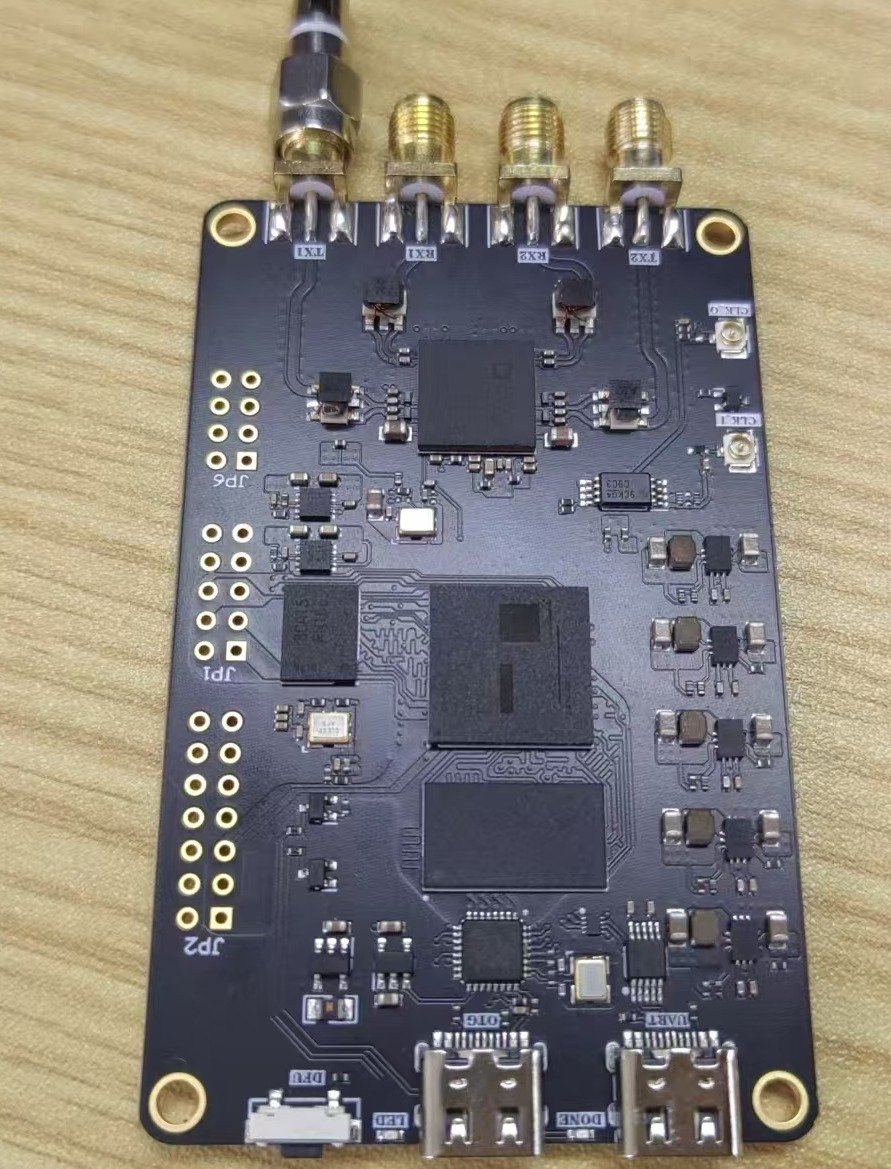
| PlutoSky P1 | Use the device as an AM transmitter or receiver. Confirm that it is accessible over USB or the network. |
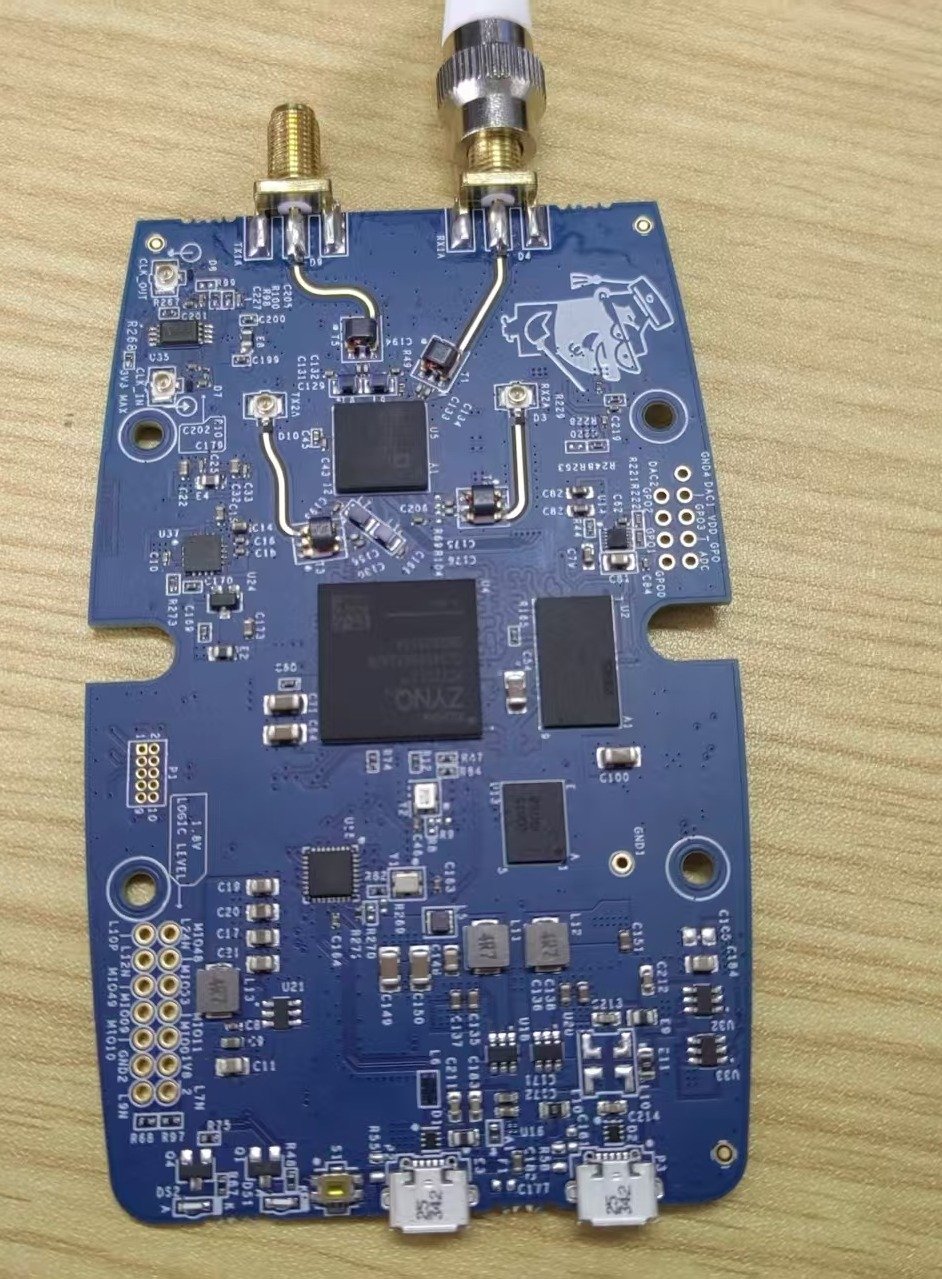
| PlutoSDR | Use a second SDR to observe the transmitted spectrum or as an independent receiver for verification. |
| Antennas and RF Cables | Select antennas for the frequency band used in the experiment. Maintain a safe distance between the transmitter and receiver to avoid input overload. |
| USB Data Cables x 2 | Connect one cable to the PlutoSky P1 data port. The other can be connected to the power or DEBUG port to prevent restarts caused by insufficient power. |
Software Checklist
| Software | Purpose |
|---|---|
| Ubuntu 20.04 | Run GNU Radio and the PlutoSDR IIO module. |
| GNU Radio 3.10 or a compatible version | Open and run the four AM GRC flowgraphs. |
| libiio / iio_info -s | Query the PlutoSky P1 IIO context URI and verify that the device is recognized |
| Windows + SDRSharp | Observe and listen to the transmitted signal at 500 MHz in AM mode. |
Experiment Files and Flowgraphs
| File | Function | Input / Output |
|---|---|---|
| AM_dsb_tc.grc | Single-tone AM modulation simulation | Signal Source + DC → carrier → Time / FFT |
| AM_envelope_demod.grc | Envelope detection simulation | AM → Abs / Complex Magnitude → LPF → message |
| AM_dsb_tc_Pluto.grc | PlutoSky P1 audio transmission | WAV 48 kHz → x20 → LPF → PlutoSDR Sink |
| AM_envelope_demod_Pluto.grc | PlutoSky P1 reception and demodulation | PlutoSDR Source → BPF → Abs → LPF → audio |
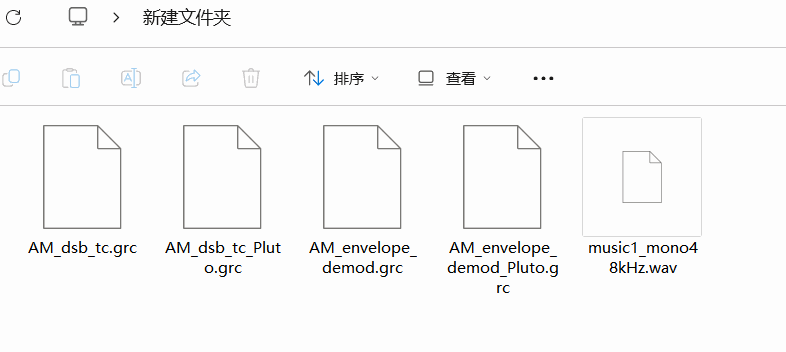
Place music1_mono48kHz.wav and the four GRC files in the same experiment directory. Use a path containing only English characters and no spaces.
AM-DSB-TC Theory and Parameter Constraints
Modulation Principle
For single‑tone amplitude‑modulation (AM‑DSB‑TC), the single‑tone message signal is summed with a DC offset. This DC offset ensures the envelope of the composite signal never crosses zero. The resultant signal is multiplied by a high‑frequency carrier signal. This multiplication shifts the baseband spectrum to either side of the carrier frequency, generating an upper sideband and a lower sideband alongside the original carrier component.
Single‑tone message signal: si(t) = Aicos (2πfit)=Aicos (ωit)
Carrier signal: sc(t) = Accos (2πfct)=Accos (ωct)
Modulated AM‑DSB‑TC signal: sam − dsb − tc(t) = [A0 + Aicos (ωit)]Accos (ωct)
Power efficiency improves as the modulation index approaches 1. When the modulation index exceeds 1, over‑modulation occurs, which distorts the time‑domain envelope and corrupts the output of envelope‑based non‑coherent demodulation.
Key Parameter Relationships
| Parameter | Recommended Value / Relationship | Significance in the Experiment |
|---|---|---|
| Message frequency fₘ | Substantially lower than the carrier frequency, fc | Determines the envelope variation rate and the audio bandwidth. |
| Carrier frequency fc | Higher than the message frequency in simulation; 500 MHz in the over-the-air example | Allows the sidebands and envelope to be separated by filtering. |
| Modulation index m | 0 < m ≤ 1 | m > 1 causes overmodulation and distortion in the envelope-detector output. |
| Audio sample rate | 48 kHz | Matches the input sample rate of music1_mono48kHz.wav. |
| PlutoSky P1 baseband sample rate | 48 kHz × 20 = 960 kHz | Increased to a rate suitable for transmission using an Interpolating FIR Filter. |
Modulation Process
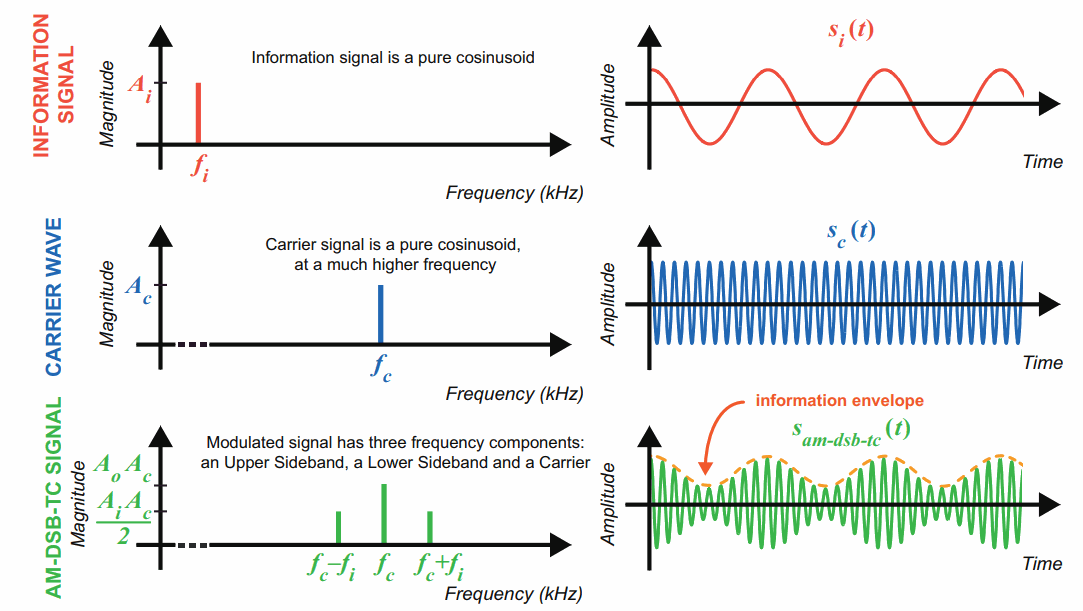
The low‑frequency baseband audio message signal is applied to amplitude‑modulate a high‑frequency carrier wave. The generated conventional AM (AM‑DSB‑TC) signal contains three spectral components: the carrier, upper sideband and lower sideband.
The instantaneous amplitude of the high‑frequency carrier varies proportionally with the original baseband message signal. The time‑domain envelope of the modulated waveform directly replicates the waveform of the input baseband audio signal. This property enables simple non‑coherent demodulation using envelope detection at the receiver end.
GNU Radio AM Modulation Simulation
Open and Inspect the Flowgraph
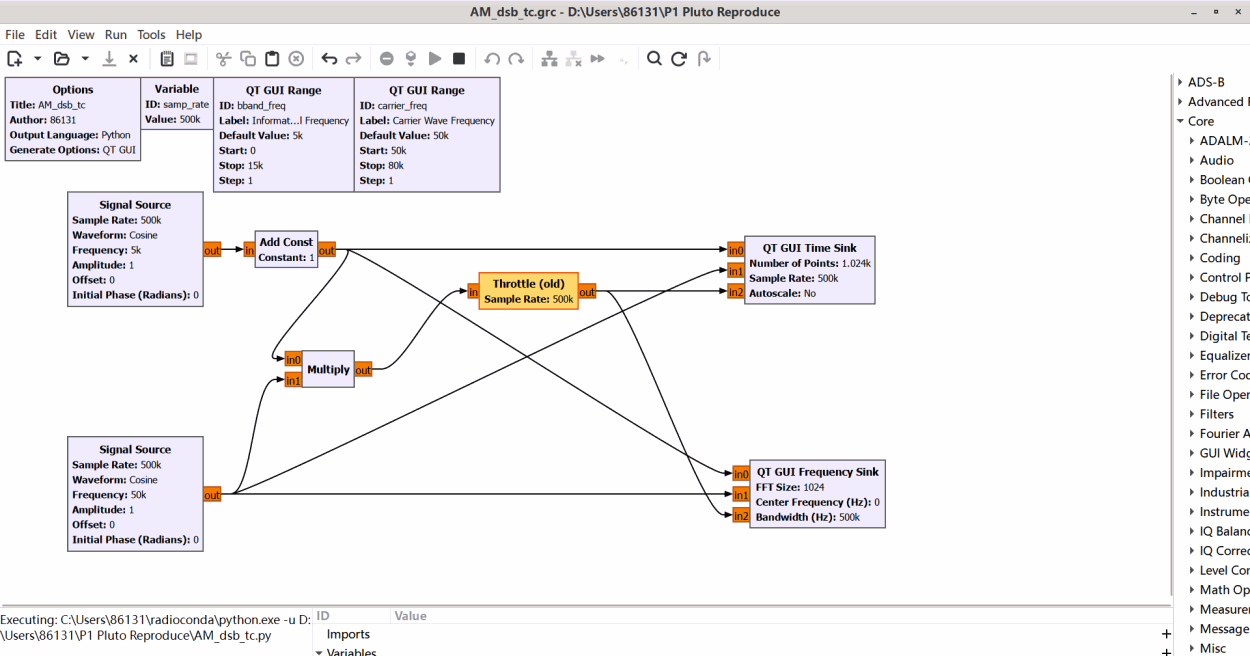
Step 1 Launch GNU Radio Companion and open AM_dsb_tc.grc.
This flowgraph implements the transmitter chain for conventional full‑carrier amplitude modulation (AM‑DSB‑TC). Unify the data‑type settings for the signal source, DC offset block (Add DC), carrier source, and multiplier block (Multiply), to guarantee consistent data formats across all transmitter‑side modules; mismatched data types will cause calculation errors or output distortion.
On the sending side, the Signal Source block generates a sinusoidal baseband message signal, which simulates low‑frequency audio information to be transmitted. This baseband message signal is fed into the DC offset block (Add DC). A proper DC bias is superimposed onto the alternating baseband signal, ensuring that the composite signal never crosses zero amplitude — this is a necessary condition for valid envelope detection at the receiving end.
The DC‑biased composite signal is then input to the multiplier block. Inside the multiplier, the DC‑offset baseband signal is multiplied sample‑by‑sample by the high‑frequency carrier waveform generated by the carrier source block. This multiplication completes amplitude modulation: it shifts the baseband information spectrum to higher radio‑frequency positions and produces the final AM‑DSB‑TC transmitted signal.
Two sink blocks are used for transmitter‑side observation: the Time Sink visualizes the time‑domain waveform and envelope of the modulated output signal before transmission; the FFT Sink analyses the frequency spectrum, displaying the carrier component, upper sideband and lower sideband generated after amplitude modulation.
Step 2 Execute the flowgraph and adjust transmitter‑side parameters to observe time‑domain and frequency‑domain characteristics.
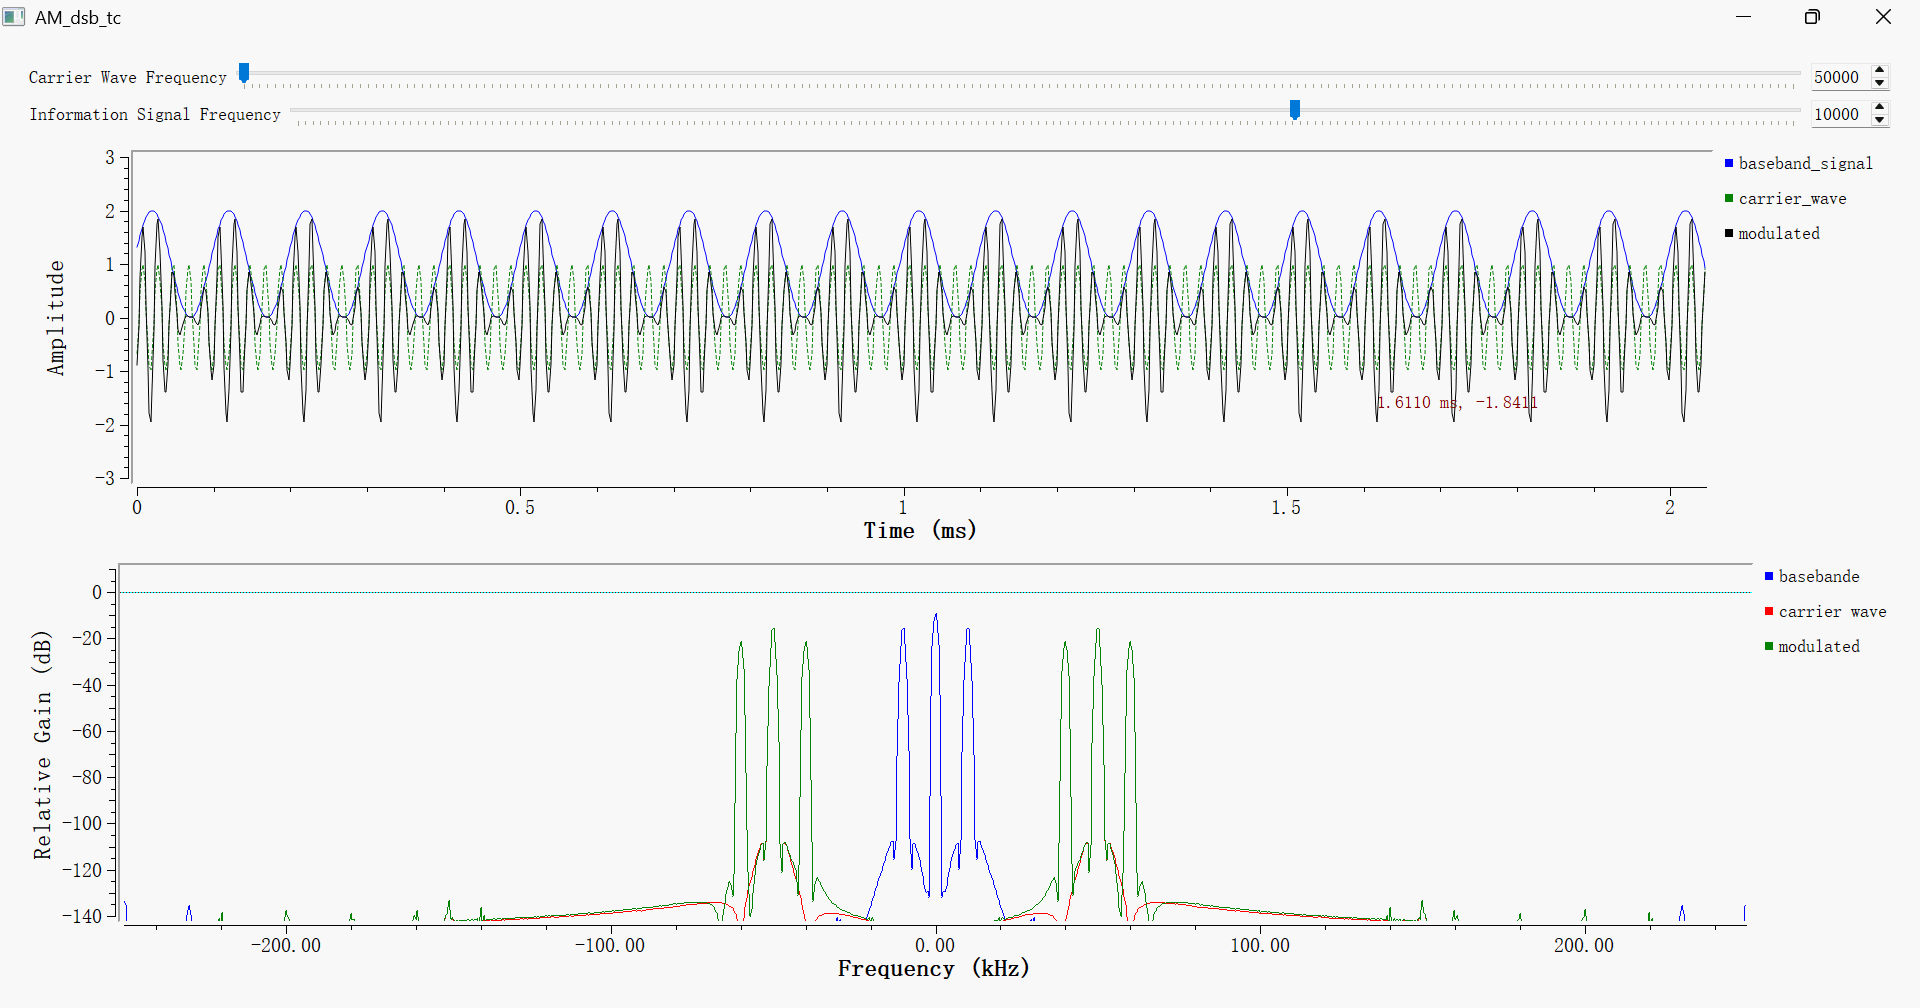
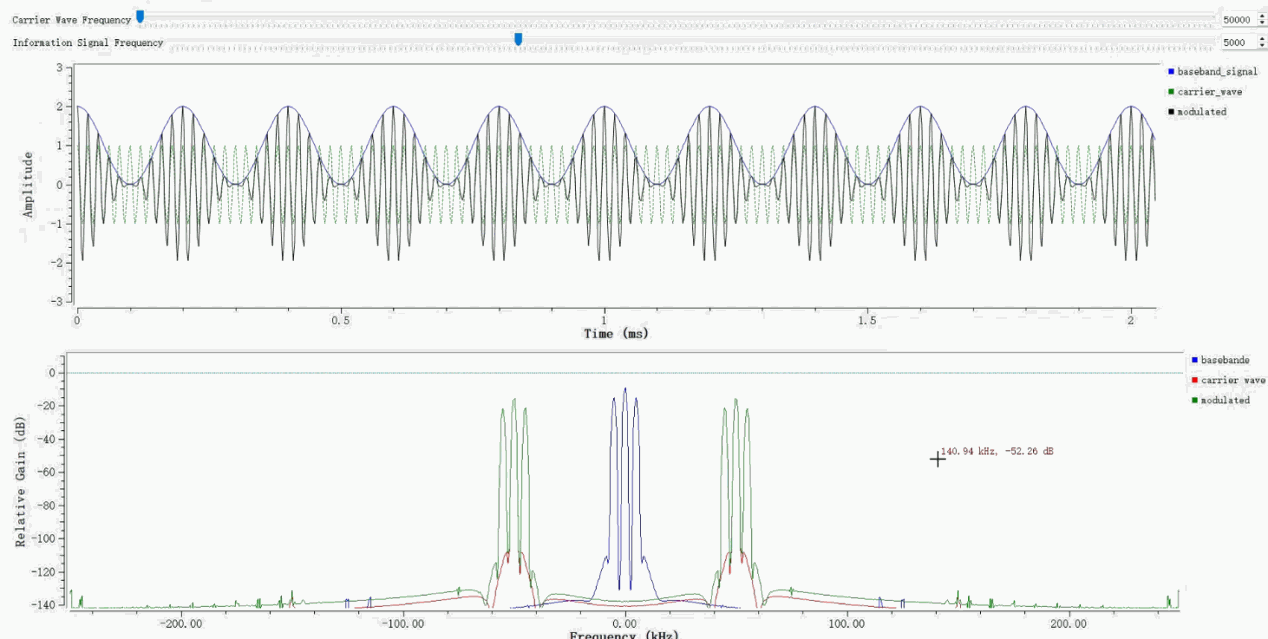
Click the run button to bring up the simulation graphical interface. The interface simultaneously presents time‑domain waveforms of all transmitter‑end signals and the frequency‑domain spectrum of the modulated RF‑equivalent signal. It allows you to investigate how parameter modifications affect the output modulated signal at the transmitter.
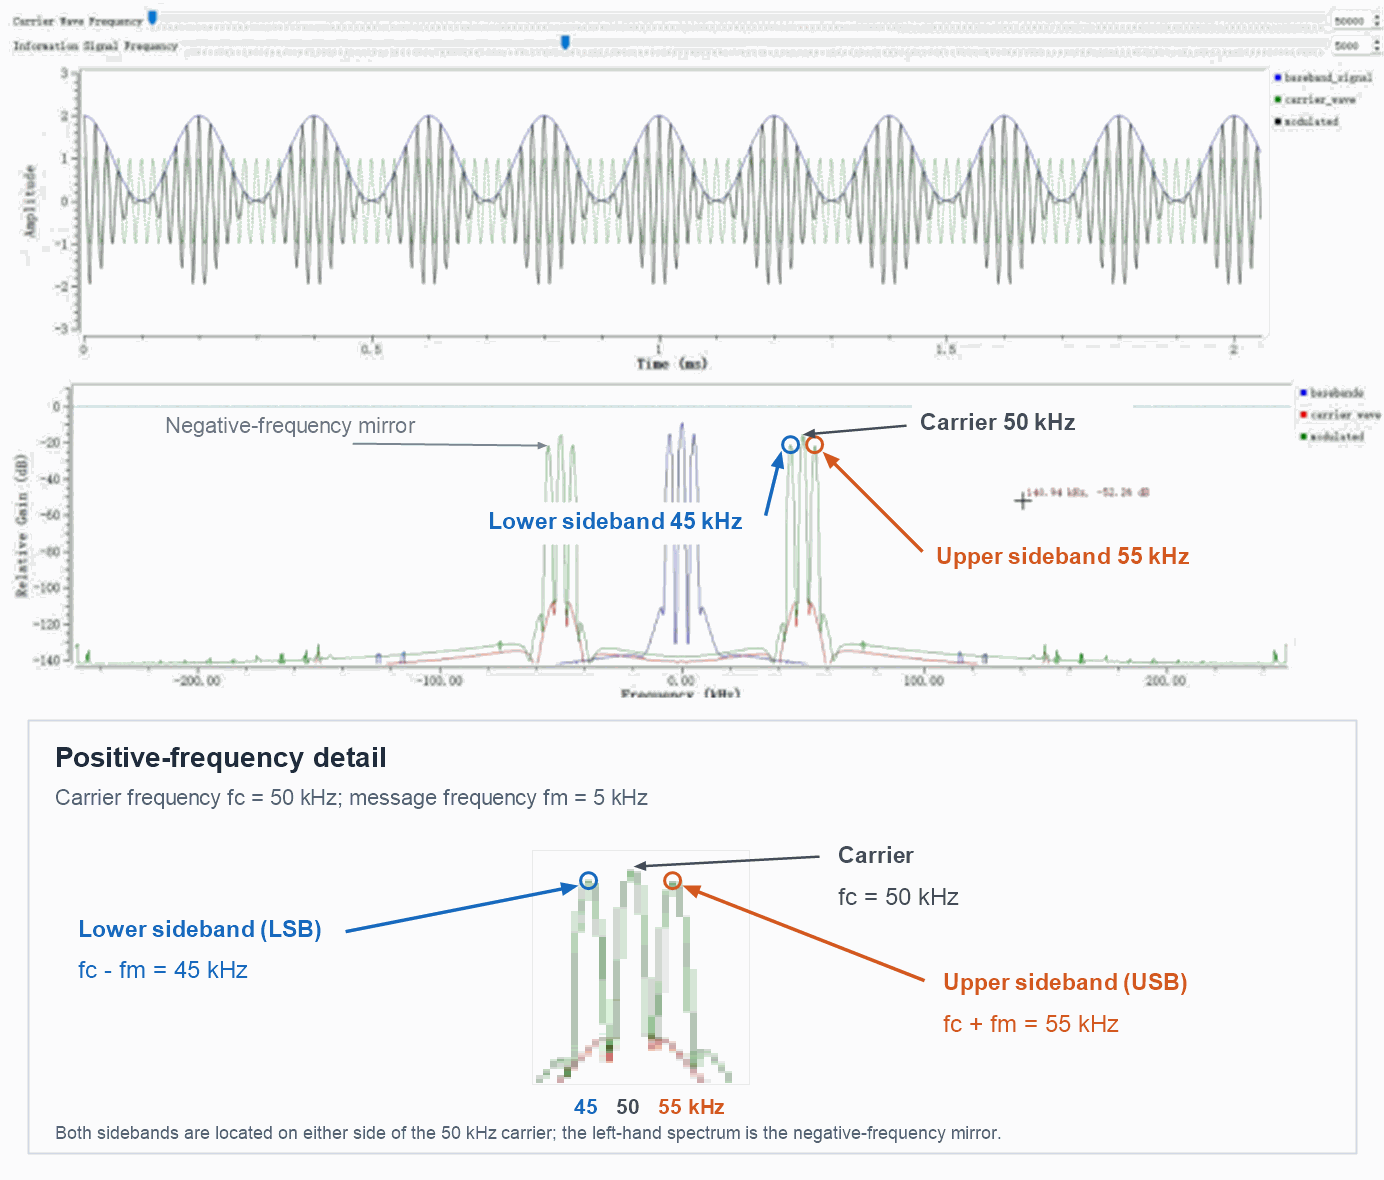
As the frequency of the baseband modulating signal rises, the frequency separation between the upper and lower sidebands increases. If only the carrier frequency is adjusted, the whole spectrum of the modulated signal shifts integrally along the frequency axis, and the bandwidth of each sideband stays unchanged.
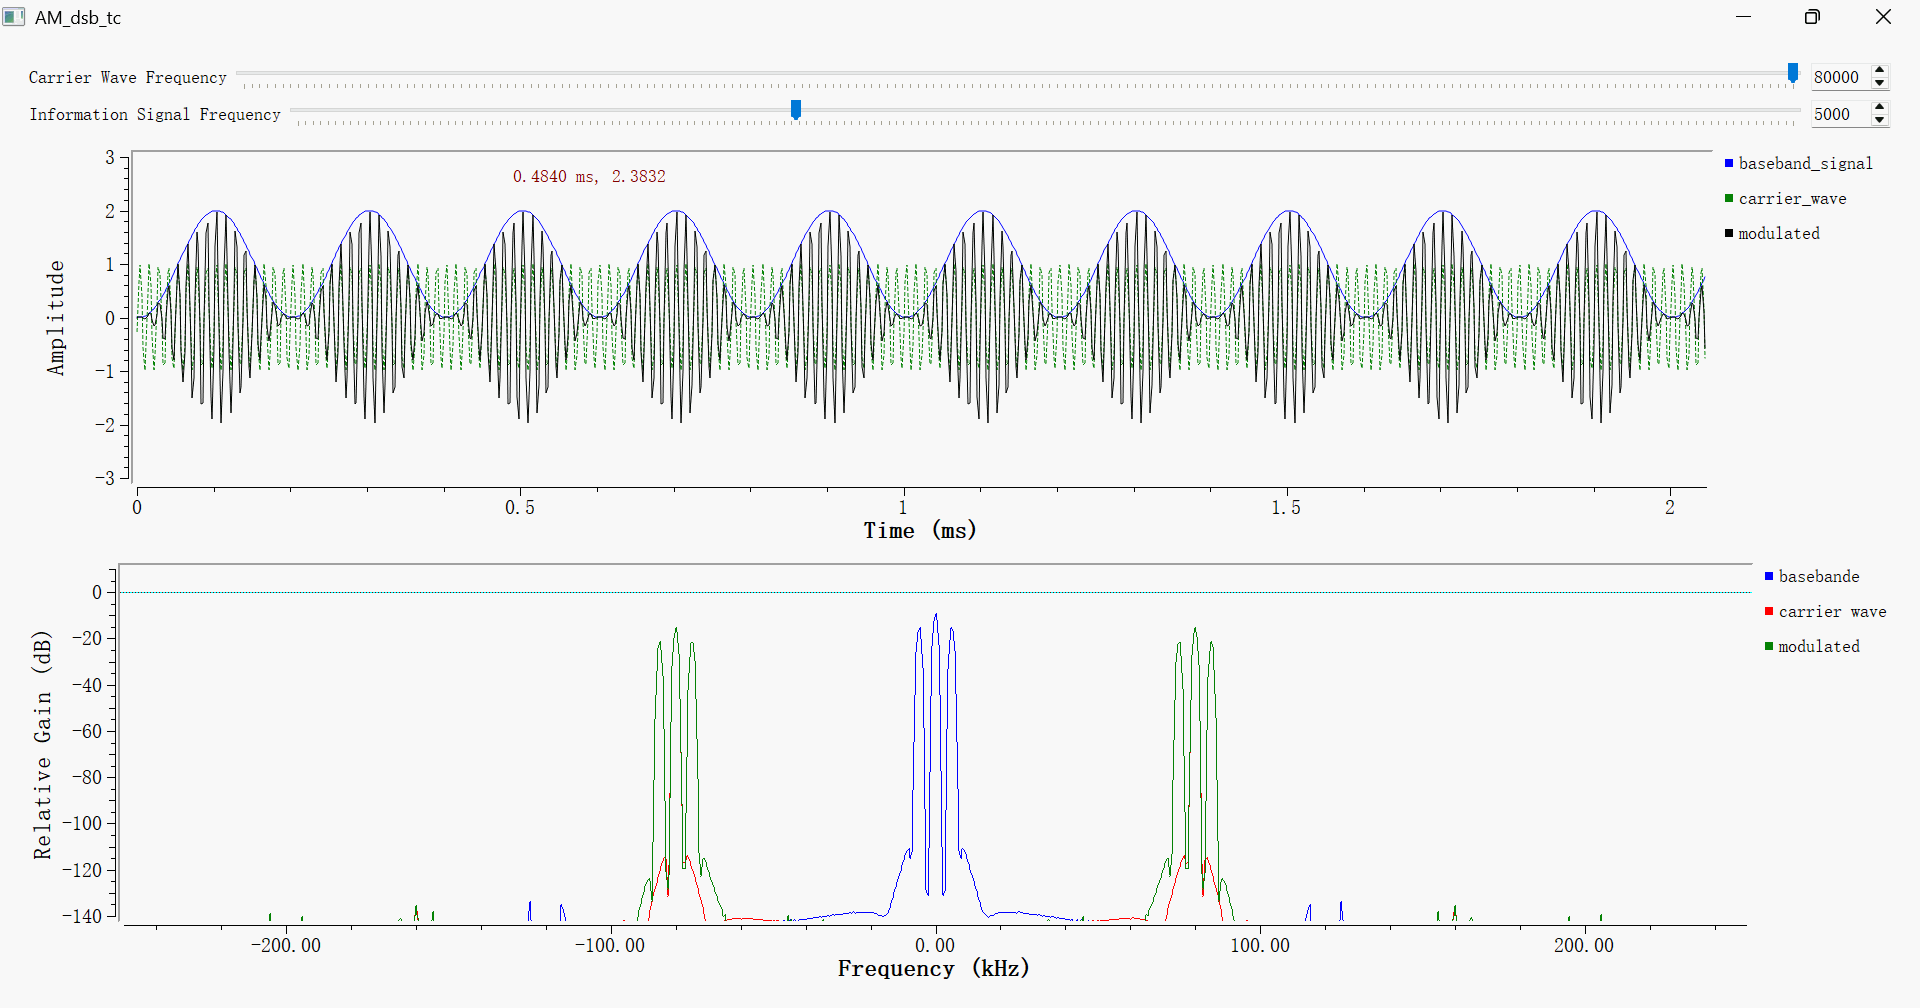
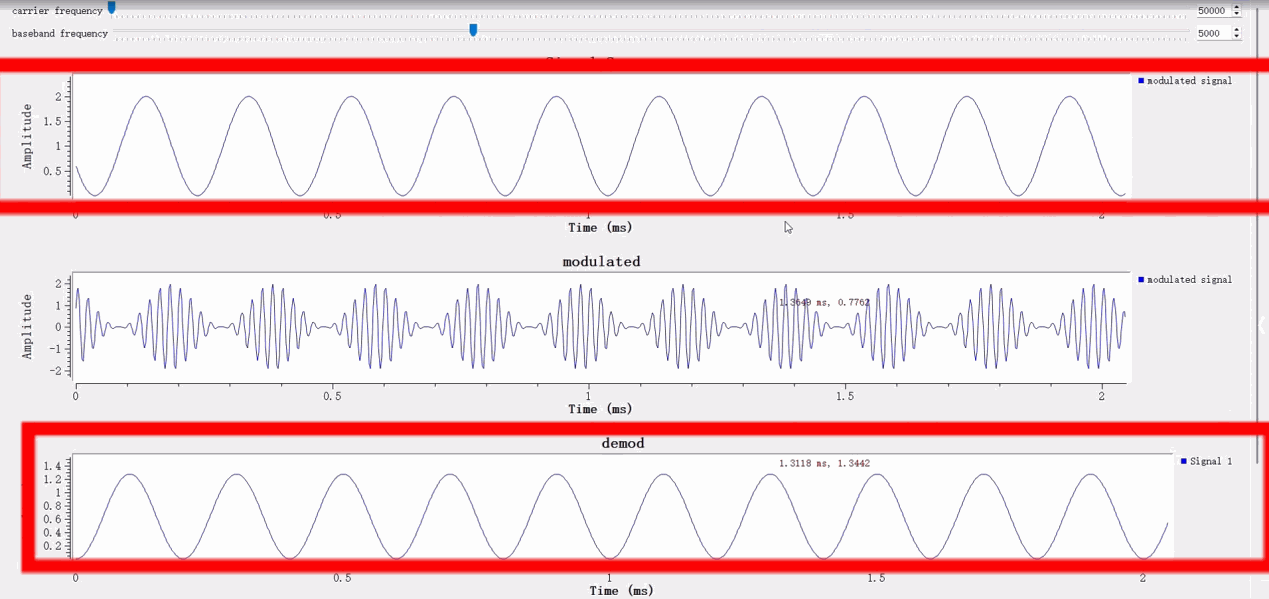
Keep the frequency of the baseband modulating signal constant and raise the carrier frequency to 80 kHz. In the transmitter‑side time‑domain waveform, oscillation cycles of the high‑frequency carrier become denser within the identical time window. In the frequency domain, both sidebands of the AM‑DSB‑TC modulated signal shift outward as a whole. The centre‑to‑centre spacing between upper and lower sidebands grows, whereas the bandwidth of each individual sideband remains unchanged, because sideband bandwidth is exclusively determined by the baseband message signal.
Set the carrier frequency to a fixed value of 50 kHz, then gradually raise the frequency of the baseband modulating signal. On the time‑domain plot of the transmitter, oscillations of the original blue baseband message signal become denser. In frequency domain, the centre positions of the two sidebands do not move, as they are locked to the carrier frequency. The bandwidth of each individual sideband expands, and the frequency gap between upper and lower sidebands becomes larger.
Simulation Analysis
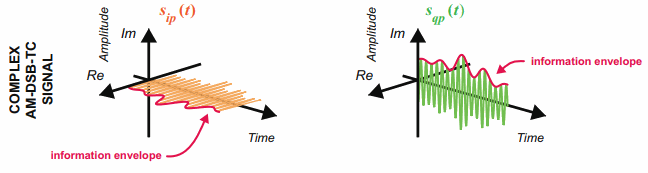
Under normal amplitude‑modulation (AM‑DSB‑TC) conditions, the outer envelope of the modulated signal follows the variation pattern of the original baseband modulating signal. Both the temporal fluctuation frequency and waveform shape of the envelope match those of the input baseband sine‑wave message signal.
It is important to make a clear distinction: the high‑frequency oscillation rate of the AM‑DSB‑TC signal itself corresponds to the carrier frequency, which is substantially higher than the frequency of the baseband message signal. A DC offset is added to the envelope to ensure that the envelope amplitude remains positive at all times. Consequently, the absolute magnitude of the envelope does not equal the amplitude of the baseband signal; only its alternating‑component variation trend replicates the original modulating signal.
In the frequency domain, one discrete carrier component together with a pair of symmetric upper and lower sidebands emerges around the carrier frequency.
Adjusting the message signal frequency simultaneously alters two features: the fluctuation rate of the time‑domain envelope and the frequency separation between the upper and lower sidebands in the frequency domain.
Adjusting the carrier frequency produces an integral shift of the entire modulated‑signal spectrum along the frequency axis.
Envelope Detection and Demodulation Simulation
Because the message information of AM‑DSB‑TC is encoded within the envelope of the transmitted modulated waveform, the receiver‑side can adopt non‑coherent demodulation for signal recovery. This demodulation method works entirely on the receiving side; it does not require the receiver to generate a local reference carrier that is perfectly matched in both frequency and phase to the carrier generated at the transmitter‑side.
Envelope Detection Principle
A classic implementation first takes the absolute value of the signal or computes its complex magnitude, then uses a low-pass filter to smooth the envelope by removing high-frequency carrier ripple. The carrier frequency must be significantly higher than the message frequency; otherwise, the low-pass filter cannot separate the envelope from the high-frequency carrier components. For I/Q data, the signal envelope is equivalent to the magnitude of the complex signal. The detector can use a Complex to Mag or Abs block.
GNU Radio Configuration
Step 1 Open the flowgraph file AM_envelope_demod.grc.
In this flowgraph, the front‑half part simulates the transmitter‑side AM‑DSB‑TC modulation, which completes amplitude modulation and outputs the modulated RF‑equivalent signal. The latter part is the receiver‑side digital demodulation chain.
Place an Abs block (or a Complex Magnitude block) immediately after the AM‑DSB‑TC modulation output (simulating the signal entering the receiver), and connect its output to a Low Pass Filter block to construct the digital envelop-detection demodulation chain.
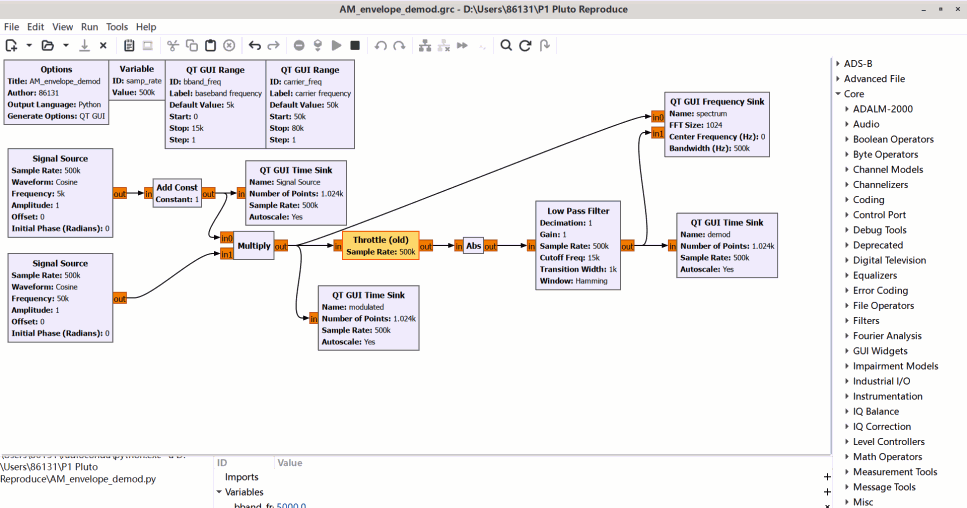
The Abs block extracts the envelope of the received AM signal, yet high‑frequency carrier‑induced ripples remain present in its output. Configure the low‑pass filter cutoff frequency to lie slightly above the message‑signal bandwidth. This setting allows the original baseband message to pass through without distortion, while attenuating high‑frequency ripples originating from the transmitter‑side carrier, so as to reconstruct the original baseband message signal.
Step 2 Execute the flowgraph and make a waveform comparison between the receiver‑side demodulated output and the original baseband message generated at the transmitter‑side.
The upper time‑domain plot displays the AM‑DSB‑TC modulated signal coming from the transmitter‑side, whose outer envelope fluctuates periodically following the shape of the baseband modulating signal. After receiver‑side envelope extraction and low‑pass filtering, the recovered baseband signal is shown in the lower plot. The variation trend of the demodulated output waveform is consistent with that of the original modulating signal.
AM Audio Transmission Using PlutoSky P1
After verifying that the AM‑DSB‑TC simulation runs without errors, replace the single‑tone sinusoidal message source with a real‑world WAV audio file. Utilize the PlutoSky P1 SDR hardware on the transmitter‑side to radiate the AM modulated signal through the antenna for over‑the‑air wireless transmission.
Transmit Flowgraph and Sample Rate
Open the flowgraph file AM_dsb_tc_Pluto.grc. This flowgraph constitutes the complete transmitter‑side hardware transmission chain for AM audio broadcast.
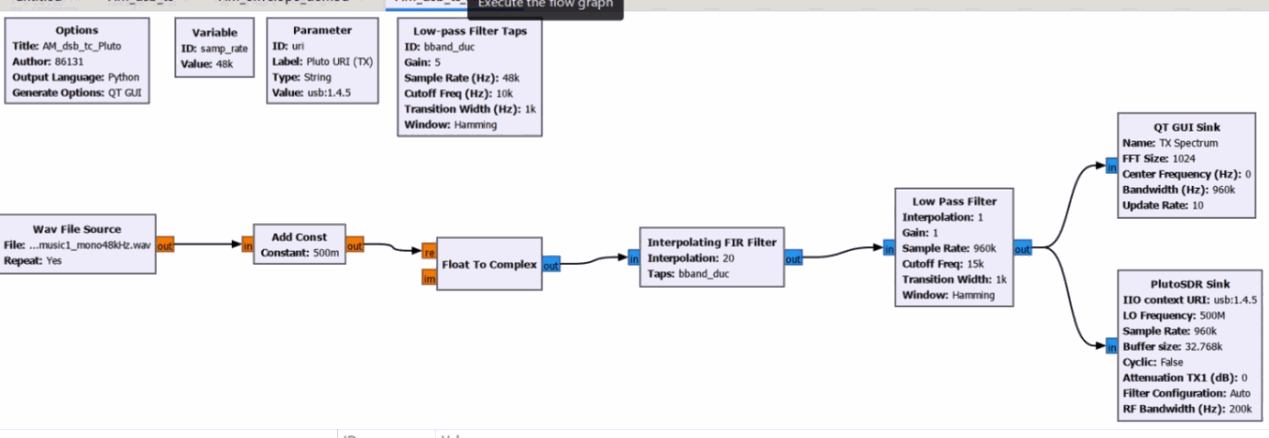
The WAV File Source block reads the audio file music1_mono48kHz.wav and outputs raw mono audio baseband data at 48 kHz sampling rate. The audio signal is then fed into the Add DC block for DC‑bias superposition and converted into complex‑format signal by the Float to Complex block, generating complex AM baseband data.
Next, configure the Interpolating FIR Filter block with an interpolation factor set to 20. This up‑sampling operation raises the baseband sample rate from the original 48 kHz up to 960 kHz, producing a higher‑rate complex baseband stream suitable for SDR hardware transmission.
Subsequently, the Low Pass Filter block suppresses spectral sidelobes and image artifacts generated in the interpolation up‑sampling process, smoothing the complex baseband waveform. Finally, the processed complex baseband signal is delivered to the PlutoSDR Sink hardware output block. The PlutoSky P1 hardware performs digital‑to‑analog conversion, RF up‑conversion and outputs the final AM‑DSB‑TC radio signal via its antenna port for wireless propagation.
| Block | Key Parameter | Output |
|---|---|---|
| WAV File Source | music1_mono48kHz.wav, mono, 48 kHz | Audio baseband |
| Add DC / Complex | DC bias and conversion to a complex signal | AM complex baseband |
| Interpolating FIR | Interpolation = 20 | Baseband signal at a higher sample rate |
| Low Pass Filter | Cutoff frequency covers the audio bandwidth | Smoothed complex baseband |
| PlutoSDR Sink | LO = 500 MHz; URI points to the device | Over-the-air AM signal |
To obtain the correct IIO device URI address required by the PlutoSDR Sink block: Open CMD terminal under Windows system, or the native terminal under Linux / macOS system. Execute the shell command iio_info -s. The returned device information contains the usable USB‑based or network‑based IIO URI for the transmitter‑side PlutoSky P1 hardware.

Frequency Domain Plot of Transmitter Signal
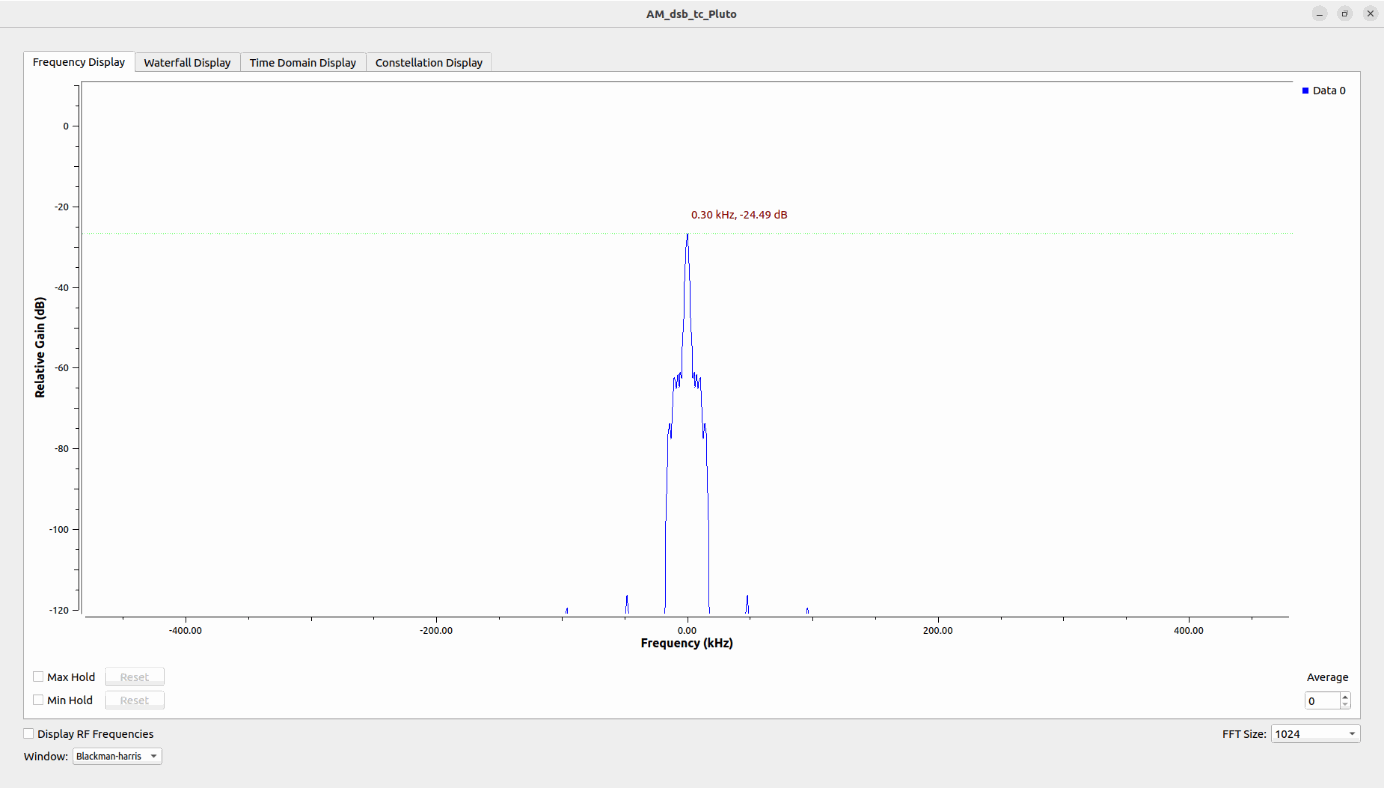
This figure shows the frequency-domain spectrum of the baseband I/Q signal at the transmitter, captured before up-conversion to the 500 MHz RF carrier for the AM‑DSB‑TC signal. After up-conversion by the PlutoSky local oscillator, the RF spectrum will be centered at 500 MHz, consisting of a carrier, upper sideband and lower sideband. The upper and lower sidebands carry the audio message information from the WAV file. The total bandwidth of the AM-DSB-TC signal is twice the maximum frequency of the input audio. Since the modulating signal is music (a composite multi-frequency audio signal), the sidebands appear as continuous spectra instead of discrete spectral lines.
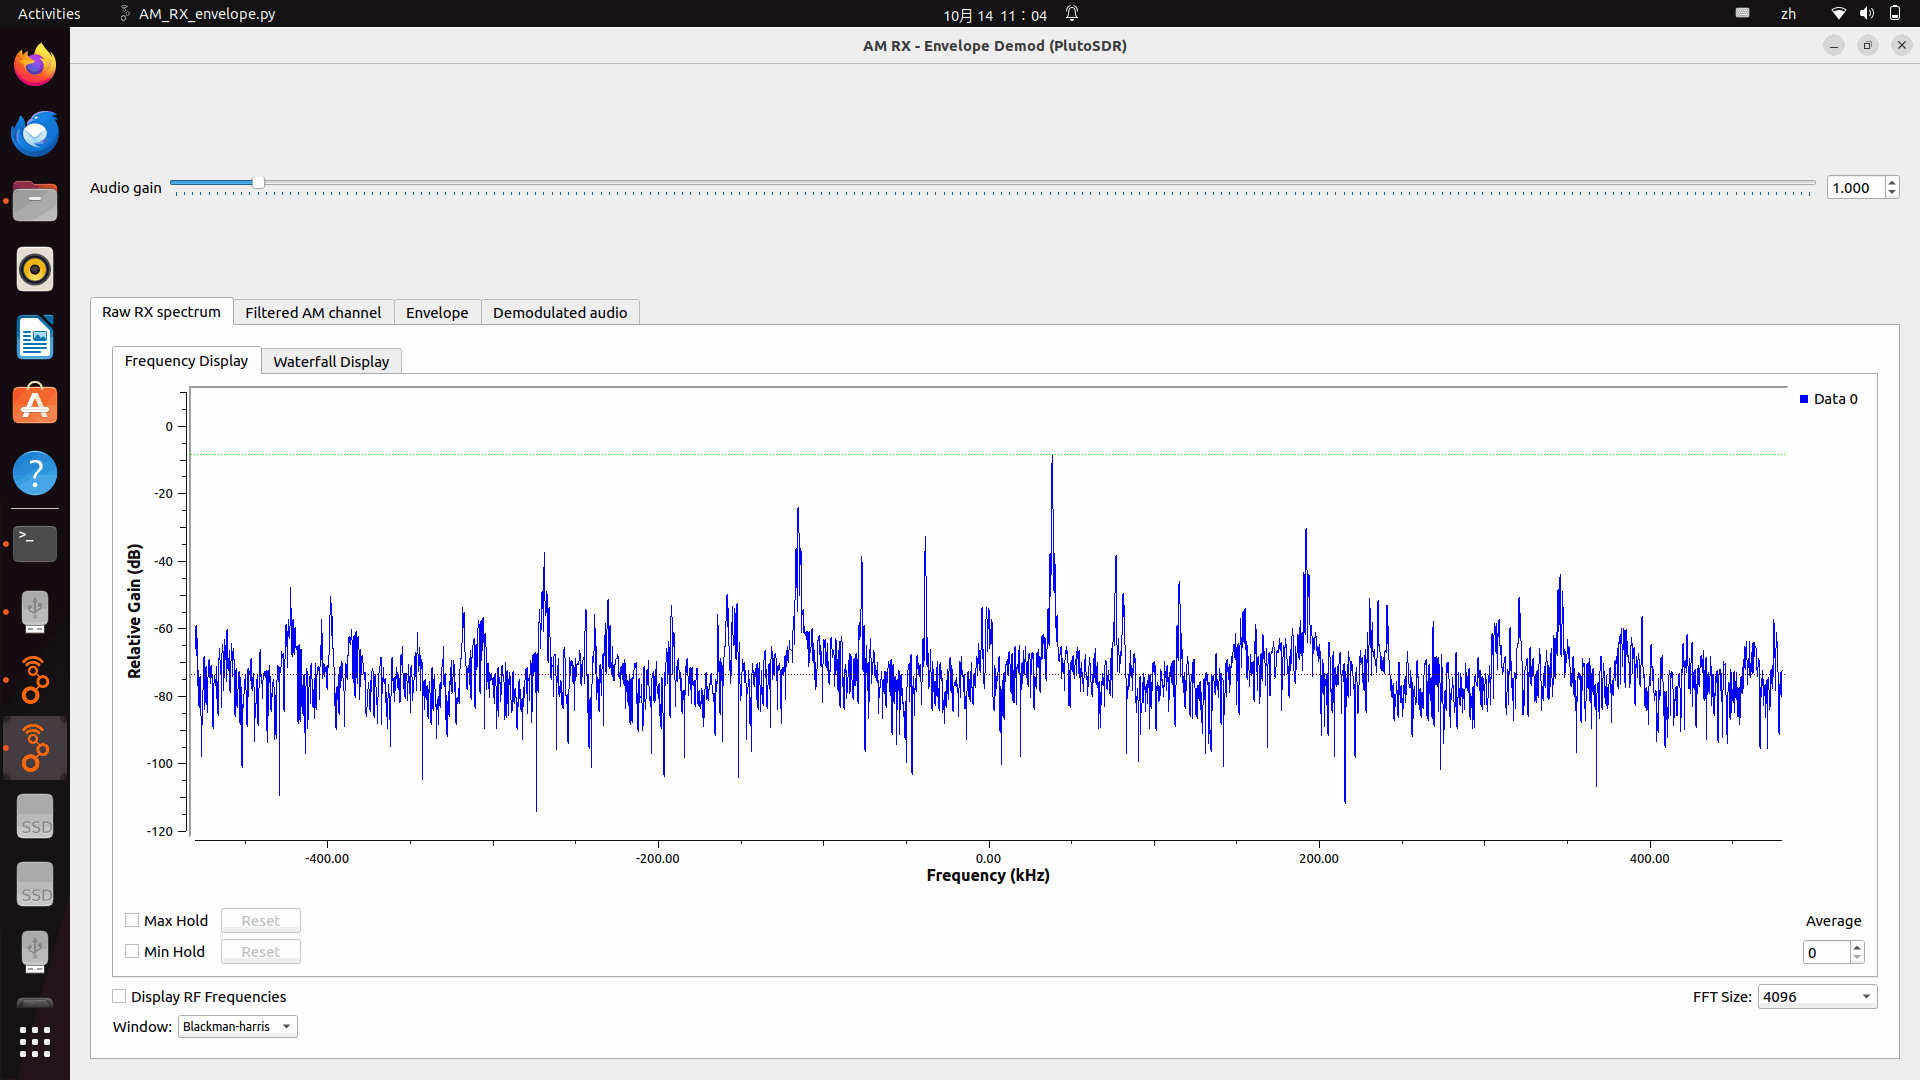
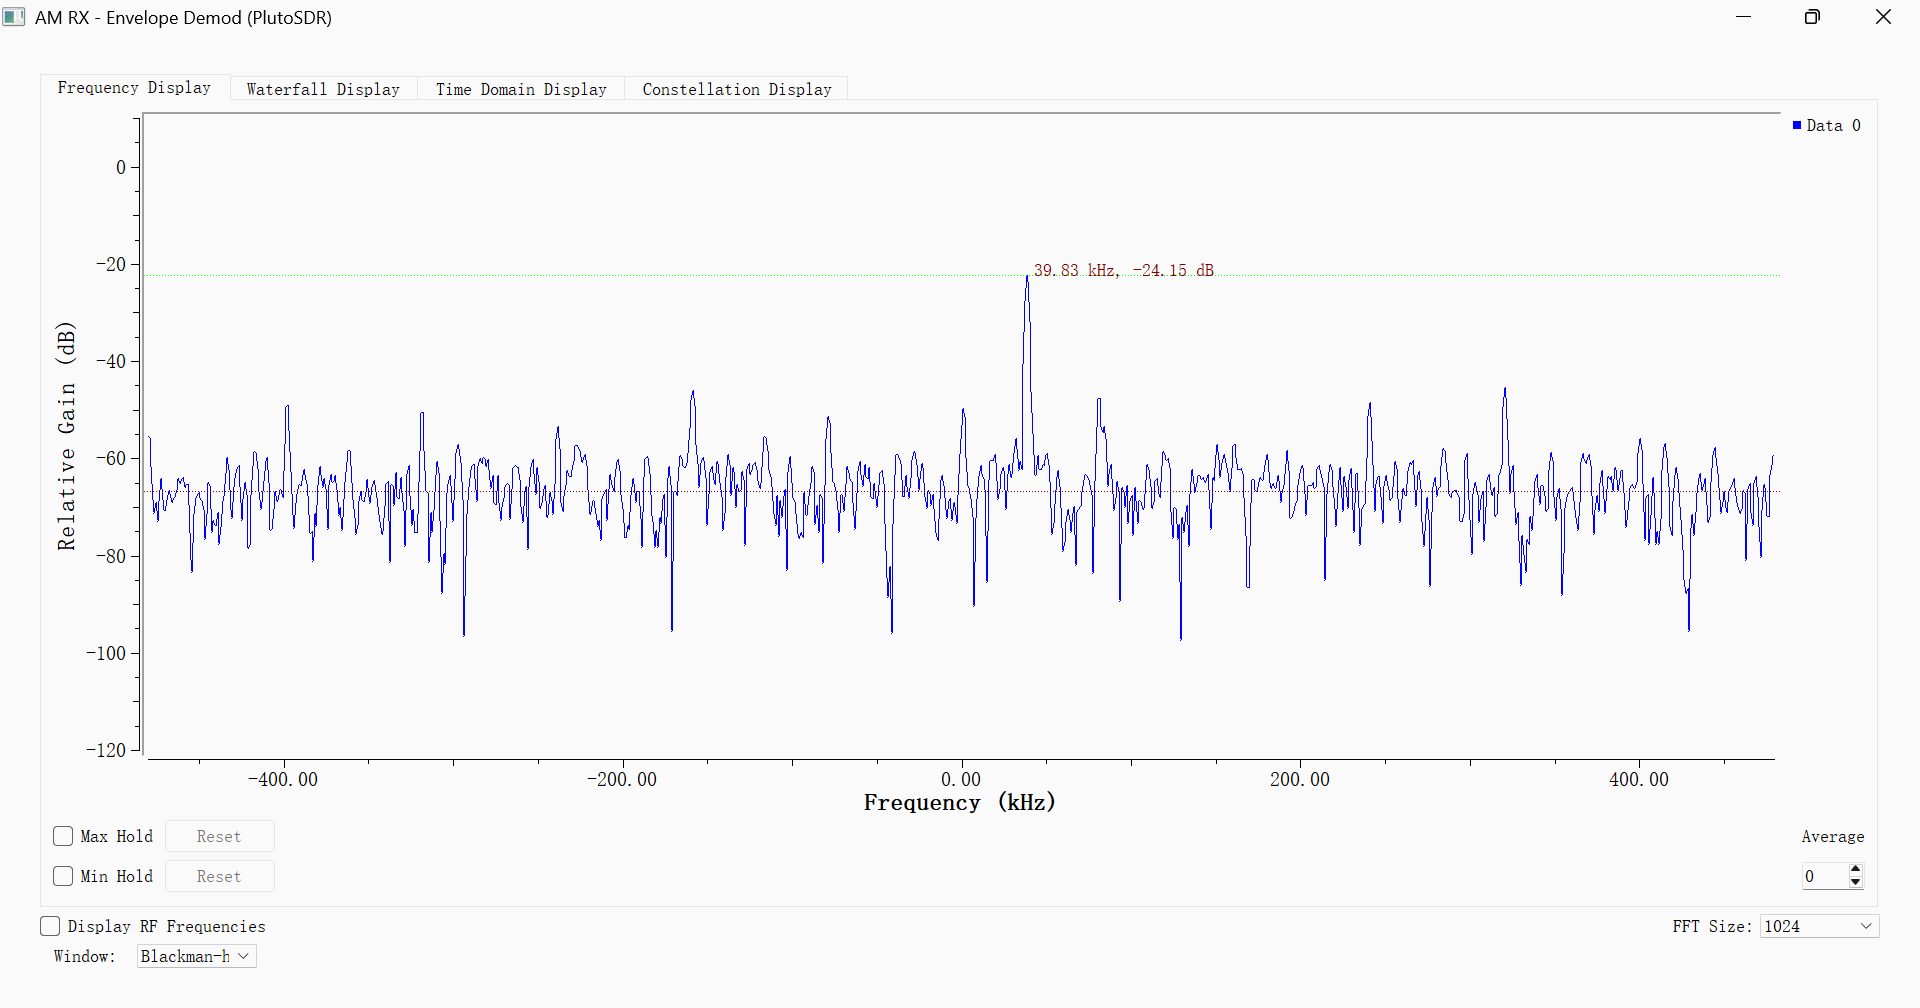
On the receiver side, a second SDR receives the 500 MHz AM signal with its local oscillator set to 499.96 MHz. After downconversion, the carrier appears at approximately +40 kHz in the complex baseband spectrum. The Raw RX spectrum tab shows the received signal before channel filtering. To examine the carrier and its upper and lower sidebands more clearly, switch to the Filtered AM channel tab and zoom in around +40 kHz. Because the modulating signal is music, the sidebands generally appear as continuous spectra rather than two isolated peaks. Wireless propagation loss reduces the received signal strength, while receiver gain settings and environmental noise also affect the displayed spectrum.
AM Audio Reception Using PlutoSky P1
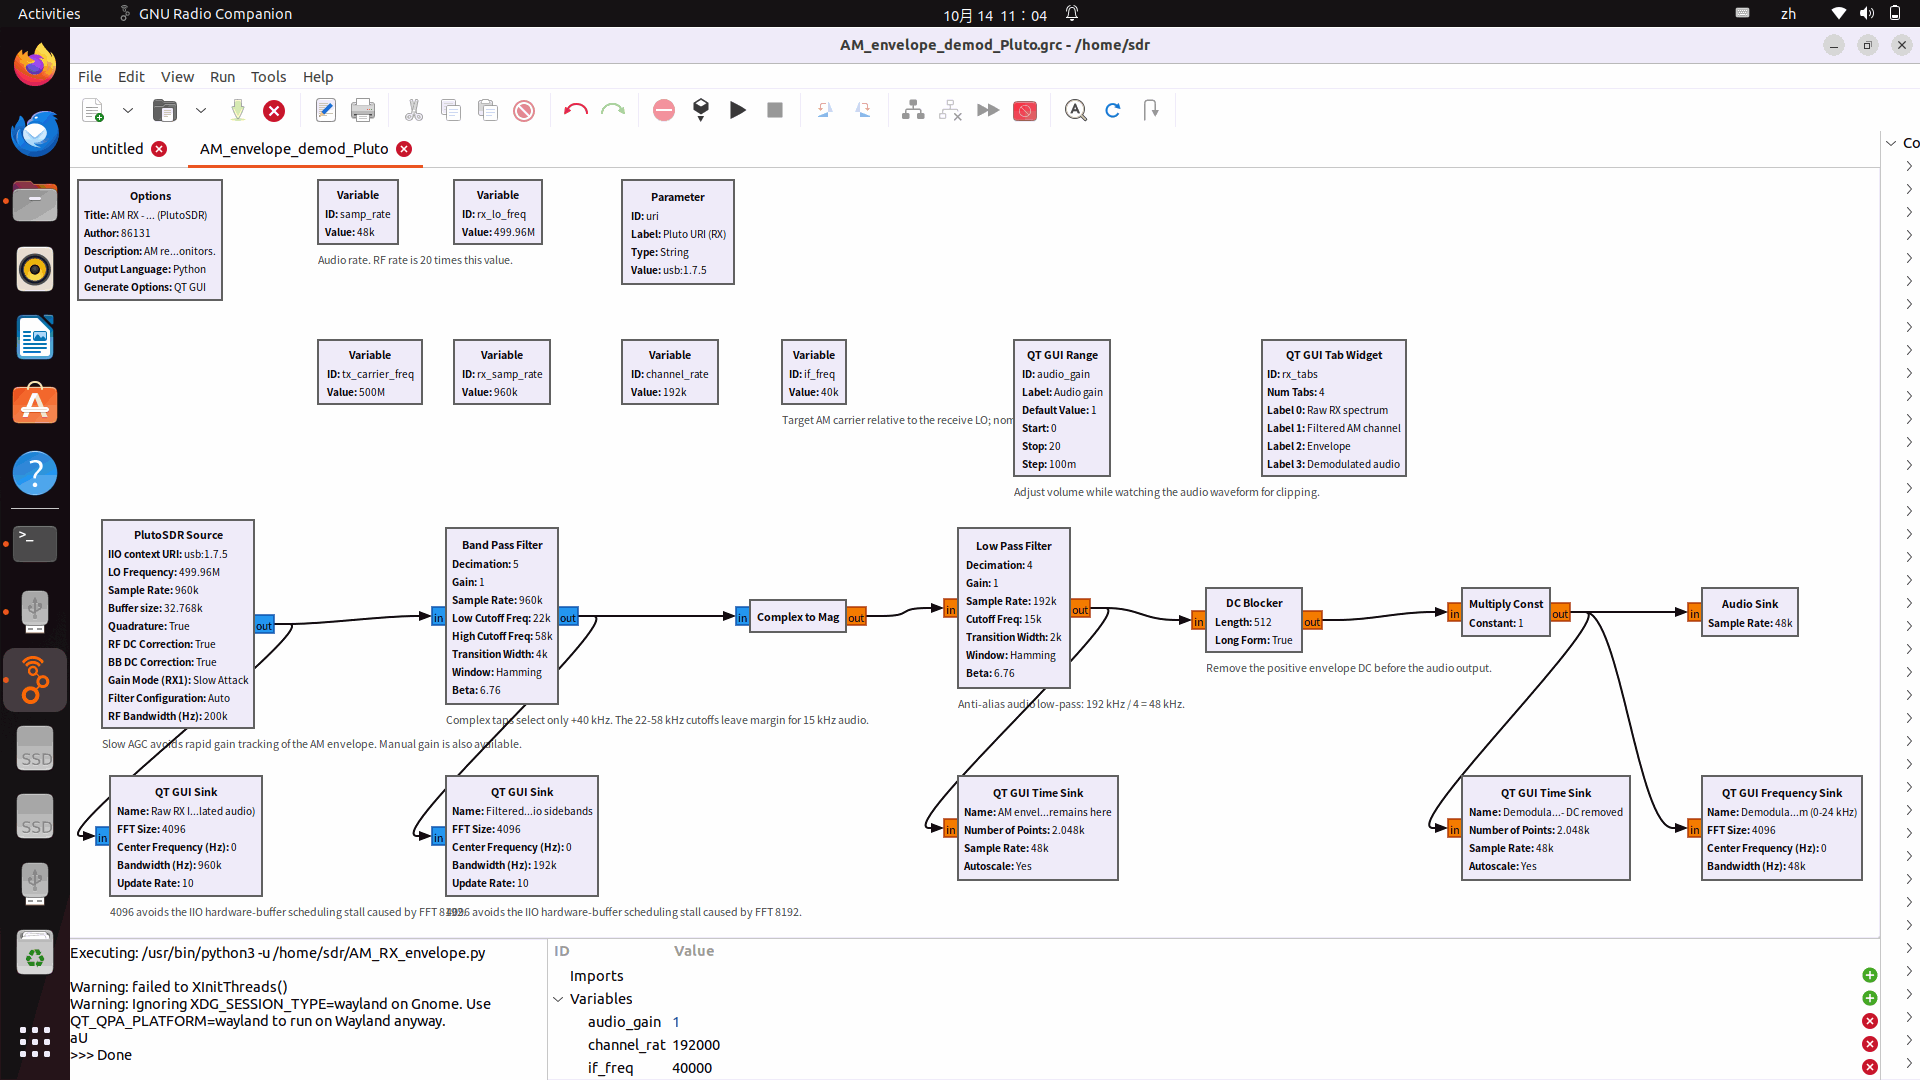
On the receiver‑side, the SDR hardware firstly down‑converts the incoming 500 MHz RF AM‑DSB‑TC signal to an intermediate frequency around 40 kHz. A band‑pass filter is then employed on the receiver‑side to extract and retain the target AM signal while rejecting out‑of‑band interference. The wireless AM‑DSB‑TC signal is radiated from the transmitter‑side, where the flowgraph AM_dsb_tc_Pluto.grc is running for real‑hardware AM audio transmission. Afterwards, the identical envelope‑detection processing chain adopted in the earlier simulation is reused on the receiver‑side to restore the original audio baseband information.
Reception Parameters
Open the flowgraph file AM_envelope_demod_Pluto.grc. This flowgraph implements the complete hardware receiving chain on the receiver‑side, which receives the over‑the‑air AM signal transmitted from AM_dsb_tc_Pluto.grc on the transmitter‑side.
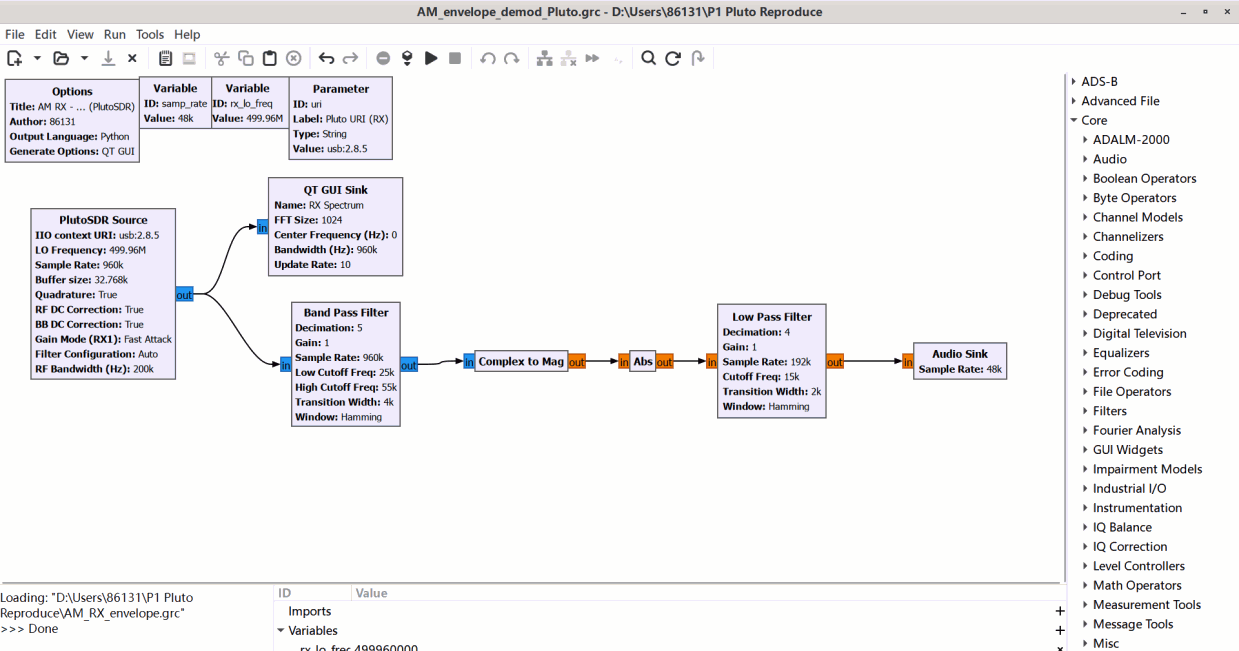
Configure the PlutoSDR Source block on the receiver‑side: set its LO Frequency to 499.96 MHz, which is offset 40 kHz below the transmitter‑side carrier frequency of 500 MHz generated by AM_dsb_tc_Pluto.grc. After digital down‑conversion inside PlutoSky P1 hardware, the AM carrier from the transmitter appears at approximately 40 kHz within the receiver‑side complex baseband.
Deploy a Band Pass Filter block on the receiver‑side to select the AM‑DSB‑TC signal centred near 40 kHz and suppress unwanted out‑of‑band noise. Next, feed the filtered signal into either a Complex Magnitude block or an Abs block for envelope extraction. Finally, pass the envelope signal through a low‑pass filter to acquire the demodulated audio baseband signal.
Verification Using SDRSharp (Receiver‑Side Cross‑Validation)
On the Windows platform, run SDRSharp as an independent receiver‑side test tool. Tune its centre frequency to 500 MHz and select AM demodulation mode. A second PlutoSky P1 hardware works as the receiving hardware to observe the carrier as well as upper‑ and lower‑sideband spectra of the over‑the‑air AM signal transmitted by AM_dsb_tc_Pluto.grc at the transmitter‑side. Meanwhile, GNU Radio on the receiver‑side plays back the demodulated audio, so that the whole end‑to‑end wireless transmission link from transmitter‑side (AM_dsb_tc_Pluto.grc) to receiver‑side (AM_envelope_demod_Pluto.grc) can be verified.
| Acceptance Check | Expected Result |
|---|---|
| PlutoSDR Source | Continuously outputs data without repeated disconnections during operation. |
| 40 kHz band-pass output | The target signal is clear and out-of-band noise is reduced. |
| Abs / Complex Magnitude | The output envelope follows the audio without sustained saturation. |
| Low Pass Filter | The output audio is continuous, and its main content matches the original WAV file. |
| SDRSharp 500 MHz / AM | The carrier and sidebands are visible, and the same audio content can be heard. |
Open SDRSharp software. Select PlutoSDR as the hardware device. Choose AM for demodulation mode. Set receiving bandwidth to 32000 Hz and centre frequency to 500 MHz.
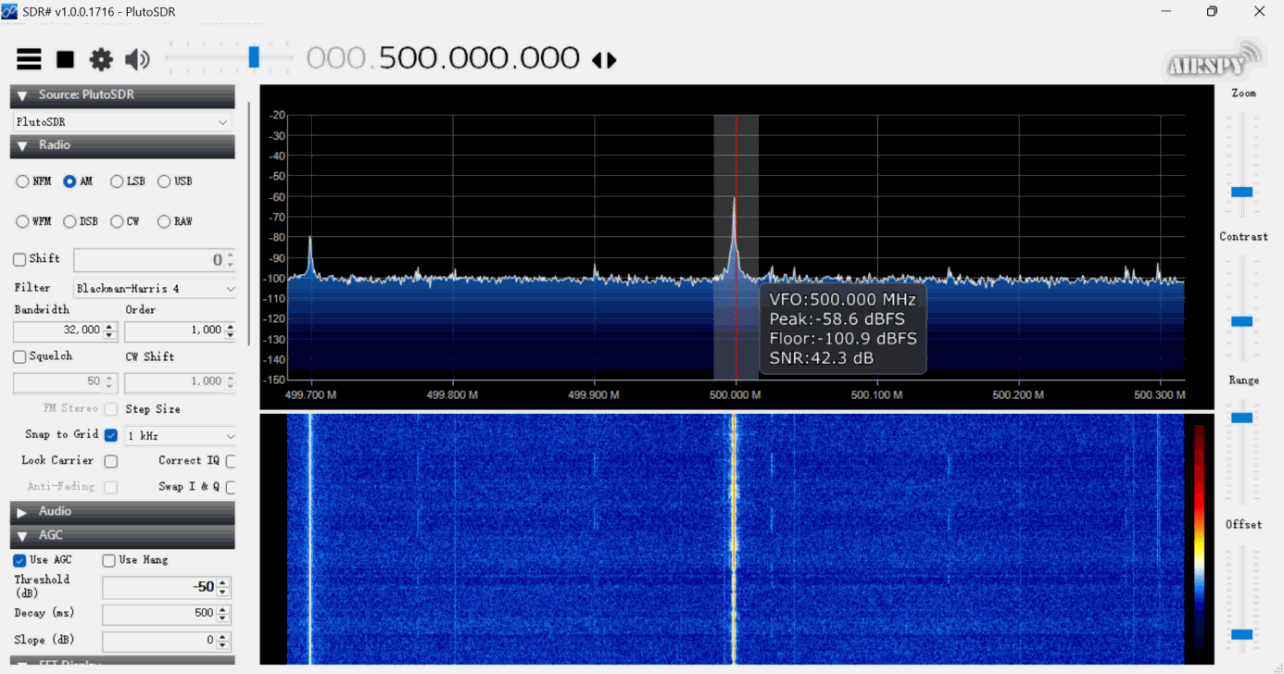
Zoom in on the spectrum window and focus on the frequency range around 500 MHz on the receiver‑side. In the spectrum display, the AM carrier peak sits at the centre position, with symmetric upper and lower sidebands distributed on both sides. The frequency offset between each sideband and the carrier corresponds to the frequency range of the baseband modulating audio signal generated from AM_dsb_tc_Pluto.grc. The lower waterfall diagram also exhibits sideband stripes on two sides of the carrier. This observation confirms that the signal received over‑the‑air is an AM‑DSB‑TC amplitude‑modulated signal transmitted from the transmitter‑side.