PlutoSky P1 BPSK User Manual
Build and test BPSK modulation, demodulation, and text transmission in GNU Radio, from software simulations to over-the-air PlutoSky P1 experiments.

Experiment Preparation and GNU Radio Project File Inventory
Hardware Checklist
| Device | Requirements and Notes |
|---|---|
| PlutoSky P1 | BPSK transmitter or receiver; verify that the device is accessible through USB or a network connection |
| SDR receiver equipment | A second PlutoSDR/PlutoSky P1 (must support IIO/libiio) for reception and verification; a standard RTL-SDR cannot directly replace the PlutoSDR Source used in the flowgraph. |
| Antennas | Use transmit and receive antennas suitable for the experimental frequency band; keep an appropriate distance between the transmitter and receiver to avoid overloading the receiver input. |
| USB cables ×2 | One cable connects to the PlutoSky P1 data port and the other to the 5V-IN power port to prevent rebooting caused by insufficient power. |
Receiver
Transmitter
Software Verification Checklist
| Software | Purpose |
| Ubuntu 20.04 | Run GNU Radio and IIO drivers for PlutoSDR. This experiment uses one Ubuntu host and one Windows host, with each host connected to a separate SDR device. |
| GNU Radio | Open and run the five BPSK-related GRC flowgraph projects; pin the GNU Radio version. |
| iio_info -s | Query the actual IIO URI and enter it in PlutoSDR Source/Sink; the usb:... URI shown in the screenshots applies only to the original test computer. |
Experiment Files and Flowgraphs
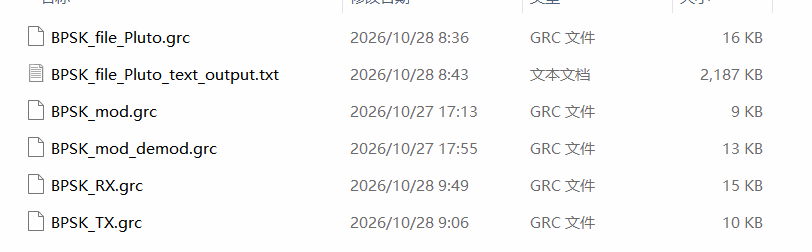
All projects in this experiment are built on GNU Radio .grc flowgraph files, which are divided into software simulation flowgraphs and hardware measurement flowgraphs. The simulation flowgraph generates and processes signals using only software signal sources and requires no SDR hardware. The hardware flowgraph relies on PlutoSky P1 / PlutoSDR RF hardware to transmit and receive real RF signals. The functions, inputs and outputs of each flowgraph are listed in the table below.
| File name | Function type | Input / Output |
| BPSK_mod.grc | BPSK signal modulation simulation | Baseband bit stream → constellation mapping + RRC pulse shaping → modulated signal → time/frequency observation |
| BPSK_mod_demod.grc | BPSK signal demodulation simulation | BPSK modulated signal → channel model → polyphase clock synchronization → slicer → recovered baseband symbols |
| BPSK_file_Pluto.grc | BPSK file software-channel simulation | Read input.txt, frame and modulate with BPSK, recover the payload through AWGN and synchronization blocks, and write BPSK_file_Pluto_text_output.txt; no Pluto hardware required. |
| BPSK_TX.grc | PlutoSky P1 hardware transmitter | Read text, frame and modulate with BPSK, then transmit at 2.4 GHz through PlutoSDR. |
| BPSK_RX.grc | PlutoSDR hardware receiver | Capture the 2.4 GHz signal and perform FLL, timing synchronization, Costas carrier synchronization, differential decoding, and file recovery. |
BPSK Modulation Fundamentals
Phase-shift keying (PSK) is a digital modulation technique that conveys information by selecting the carrier phase from a finite set of discrete phases. In complex-baseband form, a PSK symbol can be written as a_k=Ae^{jφ_k}; BPSK uses only the in-phase (I) branch, and in this experiment maps 0 and 1 to −1 and +1, respectively, corresponding to a 180° carrier phase difference. Modulations such as QPSK use both the I and Q branches. PSK-family modulations are used in wireless LANs, some RFID standards, and systems such as Bluetooth EDR.
Digital modulation schemes use a finite set of signal states to represent digital information. PSK distinguishes symbols by their phases, with each phase representing a group of binary bits. A constellation diagram is an intuitive way to describe PSK modulation: it marks symbol sampling points in the complex plane, where the horizontal axis represents the in-phase (I) component and the vertical axis represents the quadrature (Q) component.
PSK constellation points are generally arranged at equal angular intervals. This arrangement maximizes the phase separation between adjacent symbols and improves resistance to interference. PSK symbols are usually distributed on the same circle, so all symbols have equal energy and the same complex magnitude, while the amplitudes of the sine and cosine carriers that carry the information remain constant.
BPSK and QPSK are two widely used phase-shift keying schemes. In the common design where each symbol carries k bits, the number of constellation points M is usually 2^k; practical systems may also use other values of M.
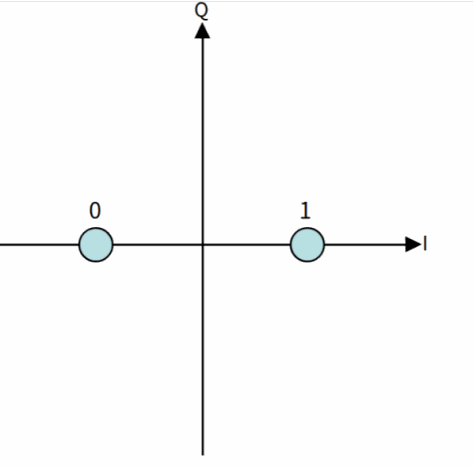
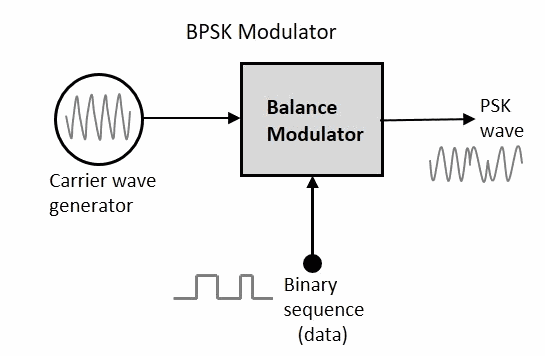
Figure: BPSK Constellation Figure: BPSK Modulator
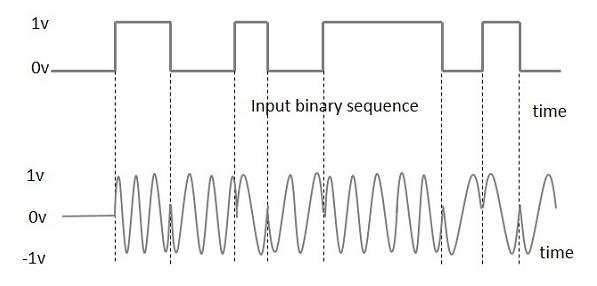
Figure: BPSK Modulation Diagram
BPSK Signal Modulation Simulation
Loading and Verifying the Flowgraph
First, import the BPSK_mod.grc file into GNU Radio. This flowgraph is used for the BPSK baseband simulation.
Start the BPSK modulation simulation. The repeating bit sequence [1,0,1,1,0] is used as the input bit stream and mapped to the constellation points −1 and +1, with rotational symmetry set to 2. The system uses 8× oversampling and root-raised-cosine (RRC) pulse shaping with a roll-off factor of 0.35. Because the Throttle block is located after the Constellation Modulator in this flowgraph, it limits the output sample rate to 100 kHz, corresponding to a symbol rate of 100 kHz/8 = 12.5 ksym/s. Use the QT GUI to observe the time-domain waveform, spectrum, and constellation.
This flowgraph uses only a software signal source and display blocks; no hardware connection is required.
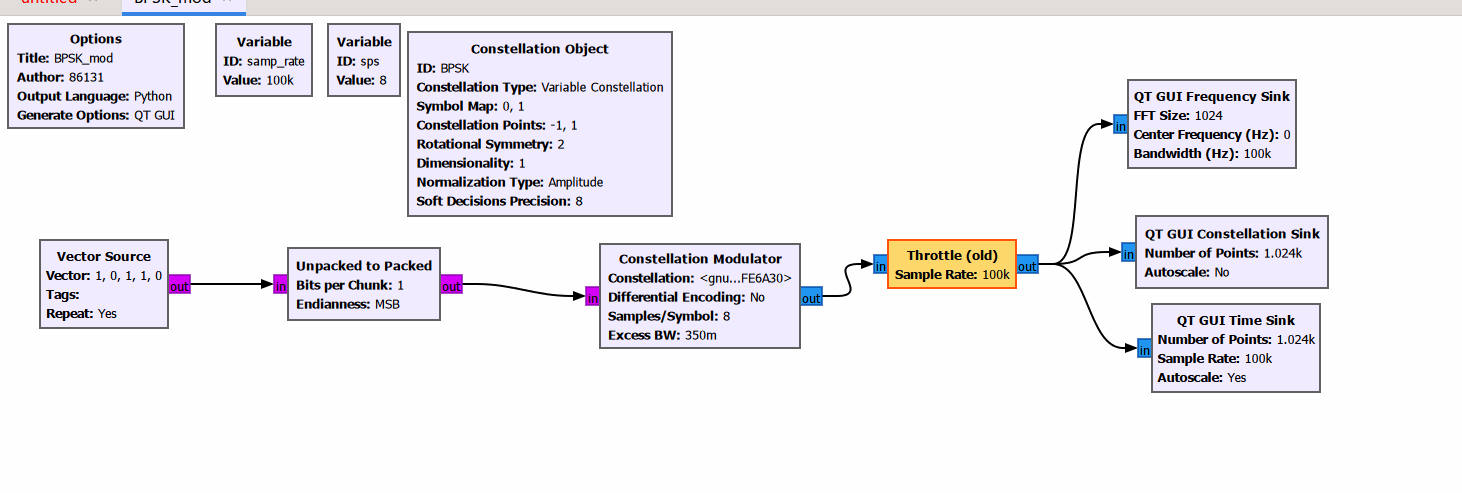
Simulation Results and Characteristics
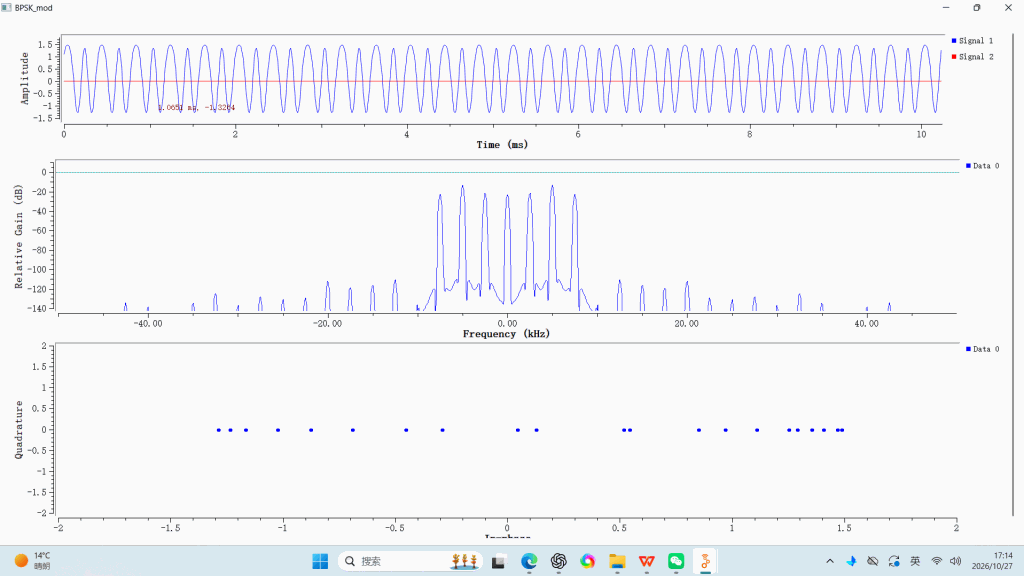
In the time-domain plot, blue represents the real part and red represents the imaginary part. The imaginary component is close to zero, indicating that the signal is entirely mapped onto the real axis, which agrees with the theoretical characteristics of BPSK.
The spectrum is symmetric around 0 Hz, as expected for a baseband BPSK signal. The experiment uses a repeating 5-bit test sequence, so the signal is periodic and the spectrum contains a comb of discrete peaks. The line spacing is 12.5 kHz/5 = 2.5 kHz.
All constellation samples lie on the real axis, and the imaginary component is nearly zero, which satisfies the BPSK symbol-mapping rule. This verifies that the BPSK modulation chain is operating correctly and has not introduced an additional imaginary signal component.
BPSK Signal Demodulation Simulation
Loading and Verifying the Flowgraph
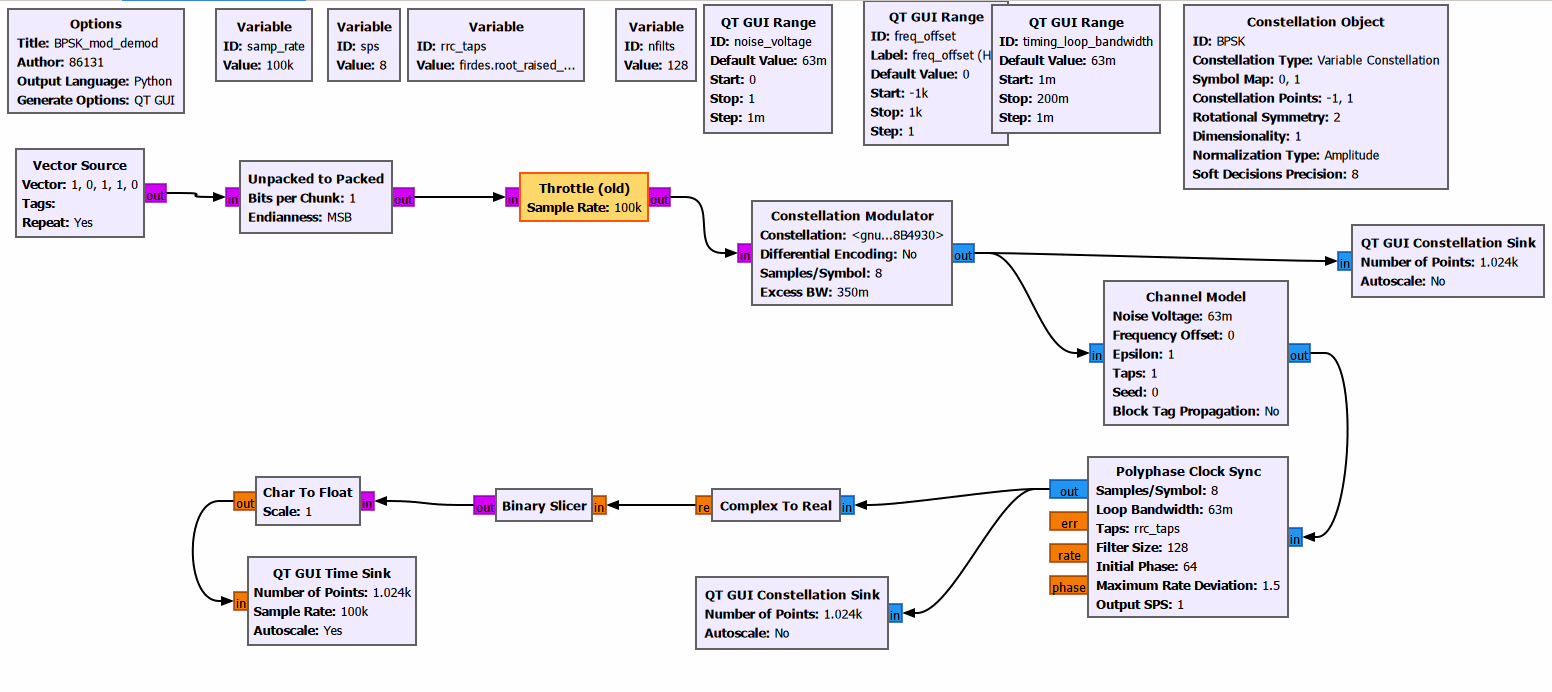
First, import the BPSK_mod_demod.grc file into GNU Radio. This flowgraph implements a closed-loop baseband BPSK modulation and demodulation simulation.
Start the BPSK simulation. The repeating bit sequence [1,0,1,1,0] is used as the input bit stream and mapped to the constellation points −1 and +1, with rotational symmetry set to 2. Note that the Throttle block is located before the Constellation Modulator in this flowgraph, so 100 kHz is the input symbol rate and the modulator output sample rate is 100 kHz×8 = 800 kS/s. The modulated signal is sent through an AWGN channel model. The noise voltage and frequency offset can be adjusted; the sliders accept values in Hz and the channel model performs the normalization internally. The receiver currently contains only a Polyphase Clock Sync block and no carrier-recovery loop, so the frequency offset must be kept at 0. To test a nonzero frequency offset, add a Costas Loop after timing synchronization and use differential encoding/decoding or a known preamble to resolve the 180° BPSK phase ambiguity. The receiver then performs complex-to-real conversion and bit slicing. Use the QT GUI to observe the transmitter constellation, the synchronized receiver constellation, and the recovered bit waveform. This flowgraph uses only software signal sources, channel simulation, and display blocks; no hardware connection is required.
Simulation Results and Characteristics
After running the BPSK_mod_demod flowgraph, the GUI provides three adjustable sliders for the timing-loop bandwidth timing_loop_bandwidth, noise voltage noise_voltage, and frequency offset freq_offset (the sliders accept values in Hz and the channel model performs the normalization internally).
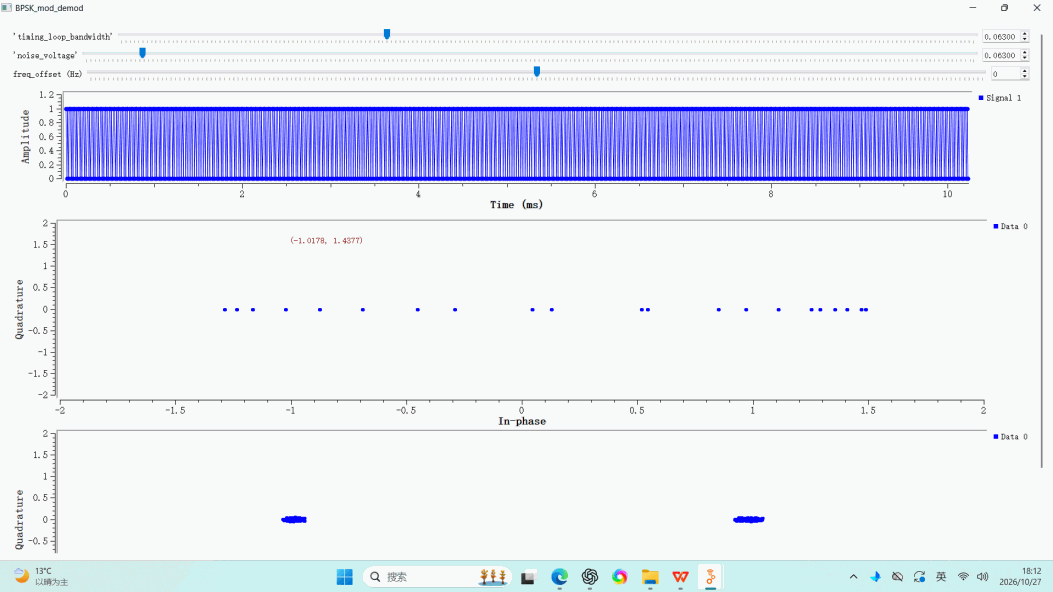
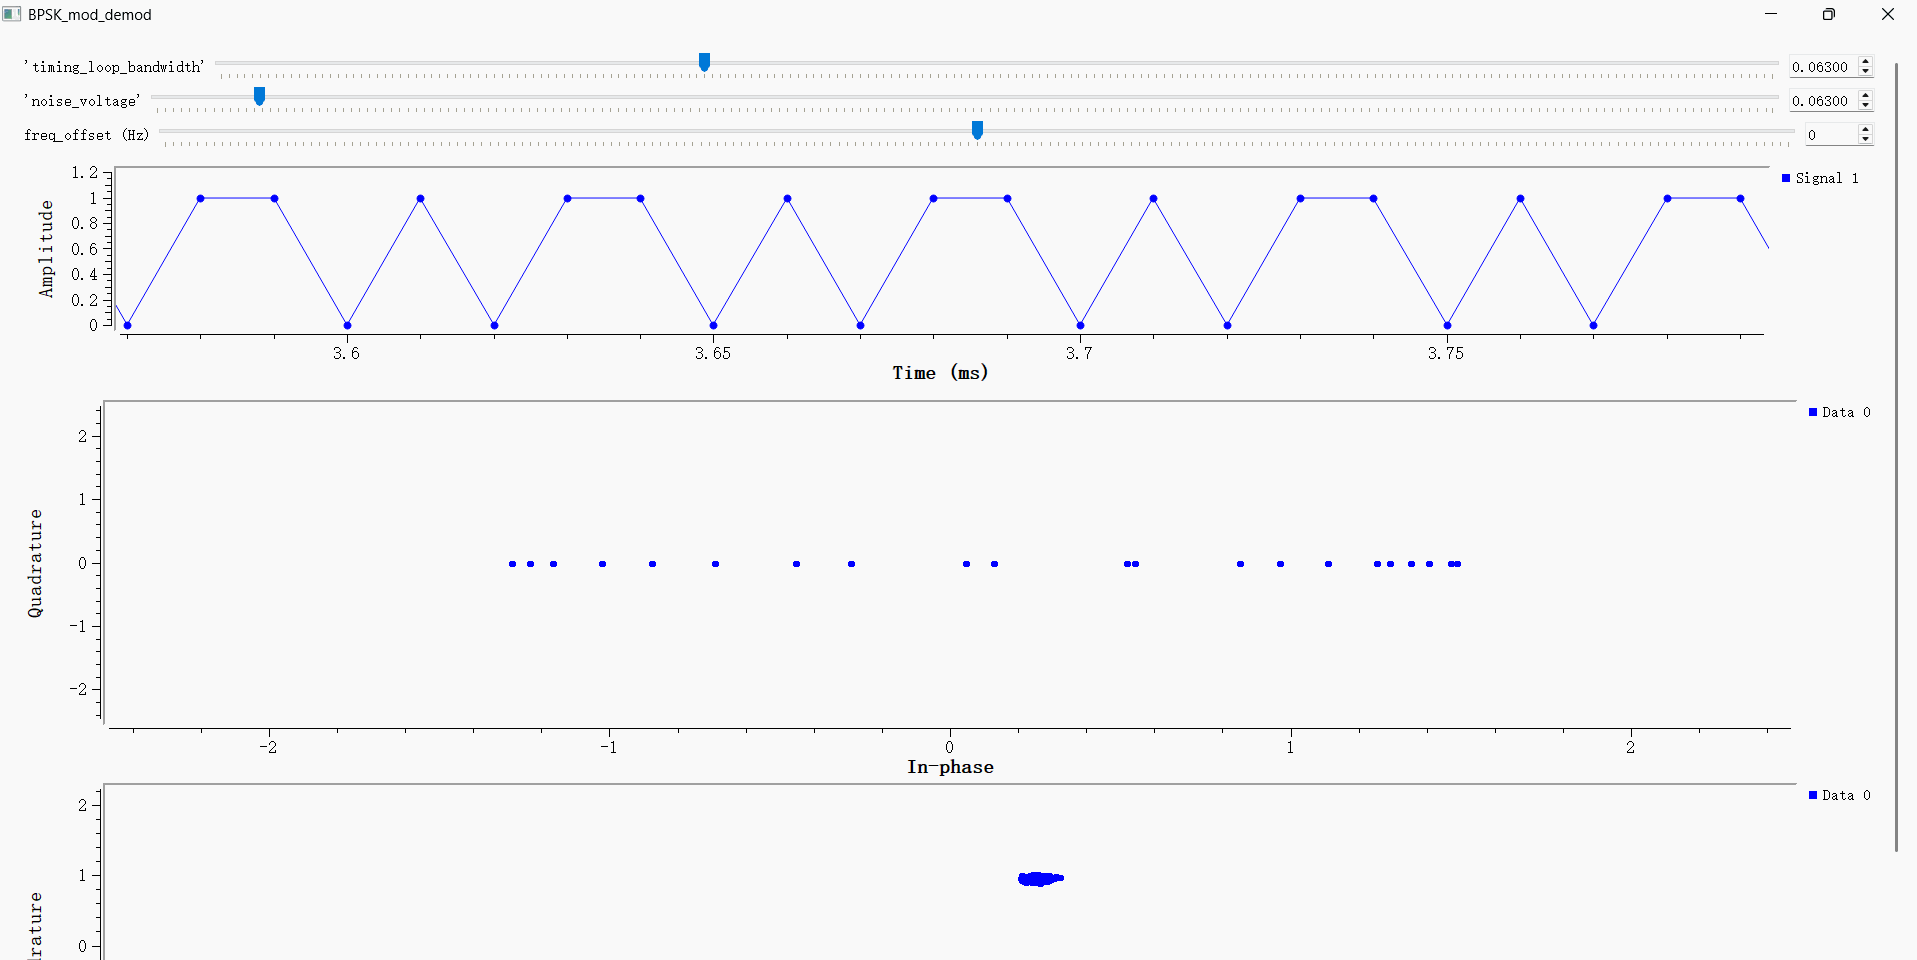
The top window is the time-domain waveform view. With the frequency offset set to 0, it shows the 0/1 bit waveform recovered after timing synchronization and slicing.
The middle constellation window is connected after the transmitter modulator and before the AWGN channel, so it does not show noise-induced dispersion. Because the signal is still an RRC-shaped oversampled waveform, samples are distributed along the real axis. A constellation sampled once per symbol after timing recovery is the appropriate view for observing the two symbol clusters at −1 and +1.
The bottom constellation window shows the receiver constellation after the AWGN channel and polyphase clock synchronization. With low noise and freq_offset=0, the constellation points converge into two regions. The second screenshot is a zoomed-in section of the time-domain waveform corresponding to the five-bit sequence [1,0,1,1,0] transmitted repeatedly by the flowgraph.
BPSK Text Transmission Simulation
Loading and Verifying the Flowgraph
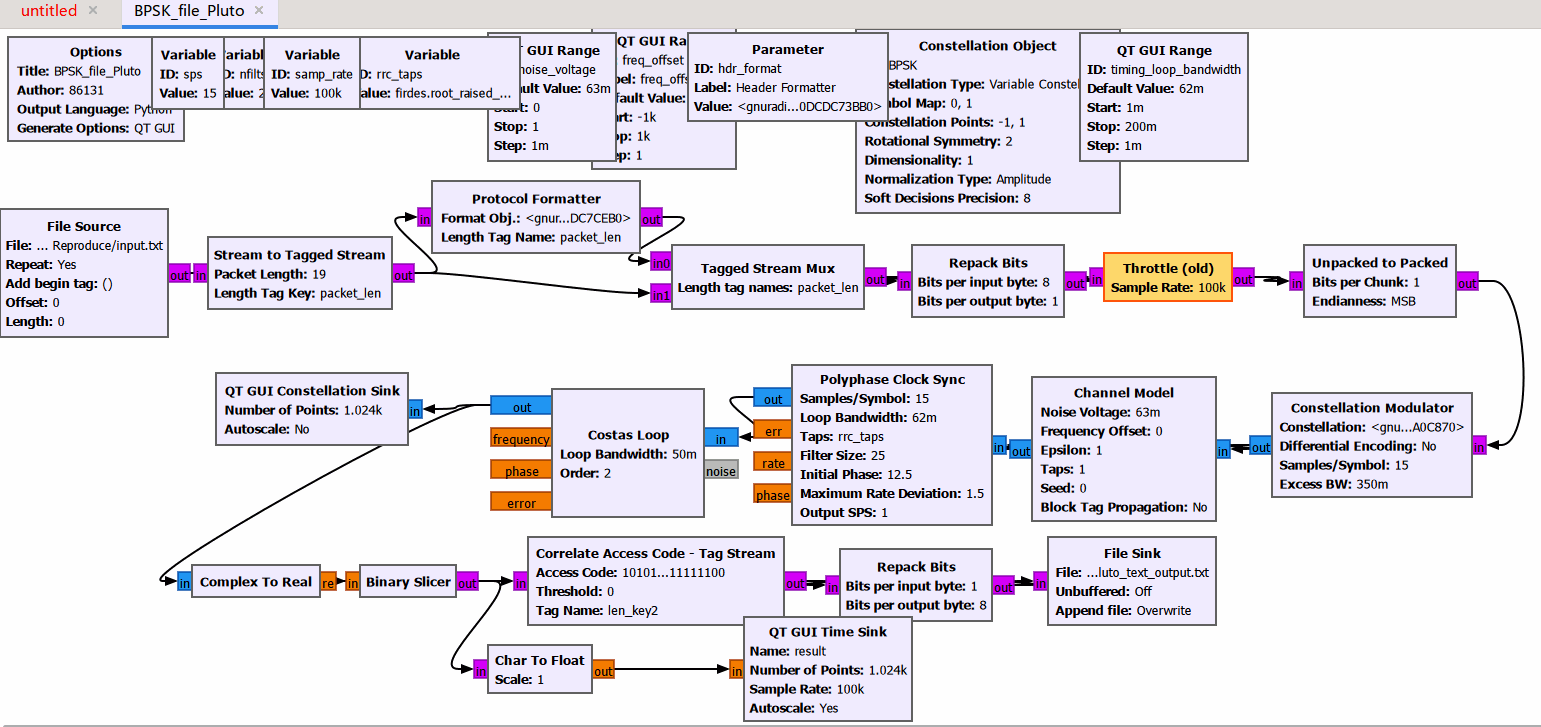
First, import the BPSK_file_Pluto.grc file into GNU Radio. It contains frame encapsulation, access-code synchronization, and joint carrier and timing synchronization, but it does not connect to Pluto hardware.
Start the BPSK file simulation. File Source reads input.txt as the payload, Stream to Tagged Stream adds packet-length tags, Protocol Formatter generates the access code and length header, and Tagged Stream Mux assembles the frame. The system uses 15× oversampling and a roll-off factor of 0.35. Because the Throttle block is before the modulator, 100 kHz is the symbol-stream rate and the Constellation Modulator output sample rate is 100 kHz×15 = 1.5 MS/s. In this experiment, BPSK maps 0 and 1 to −1 and +1, respectively, with rotational symmetry set to 2. The signal is sent through an AWGN Channel Model. At the receiver, Polyphase Clock Sync first performs timing synchronization, followed by a second-order Costas Loop for carrier synchronization. The signal then passes through complex-to-real conversion, bit slicing, and access-code correlation, which outputs the payload after removing the access code and header. The bits are finally repacked into bytes and written to BPSK_file_Pluto_text_output.txt.
Simulation Results and Characteristics
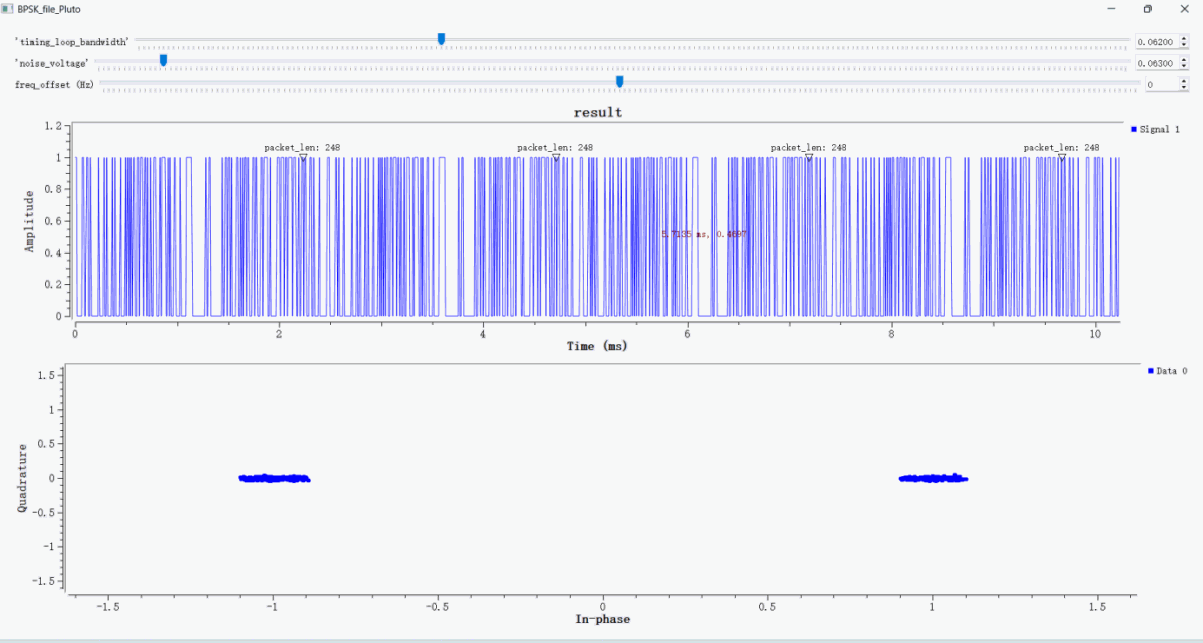
After running the BPSK_file_Pluto flowgraph, the GUI provides three sliders for the timing-loop bandwidth timing_loop_bandwidth, noise voltage noise_voltage, and frequency offset freq_offset (the sliders accept values in Hz and the channel model performs the normalization internally). The top time-domain window shows the 0/1 frame bit stream after slicing. The annotation packet_len:248 represents the complete frame length, not the final payload length. If input.txt is 19 bytes, then 248 bit = 152-bit payload + 96-bit access code and default length header. Correlate Access Code - Tag Stream outputs the payload after the access code and header. File Source is currently set to Repeat: Yes, so running for a long time continuously writes repeated payloads to BPSK_file_Pluto_text_output.txt; for a single-file check, disable Repeat or compare only the first frame.
BPSK Text Transmission and Reception Using PlutoSky P1
Transmitter
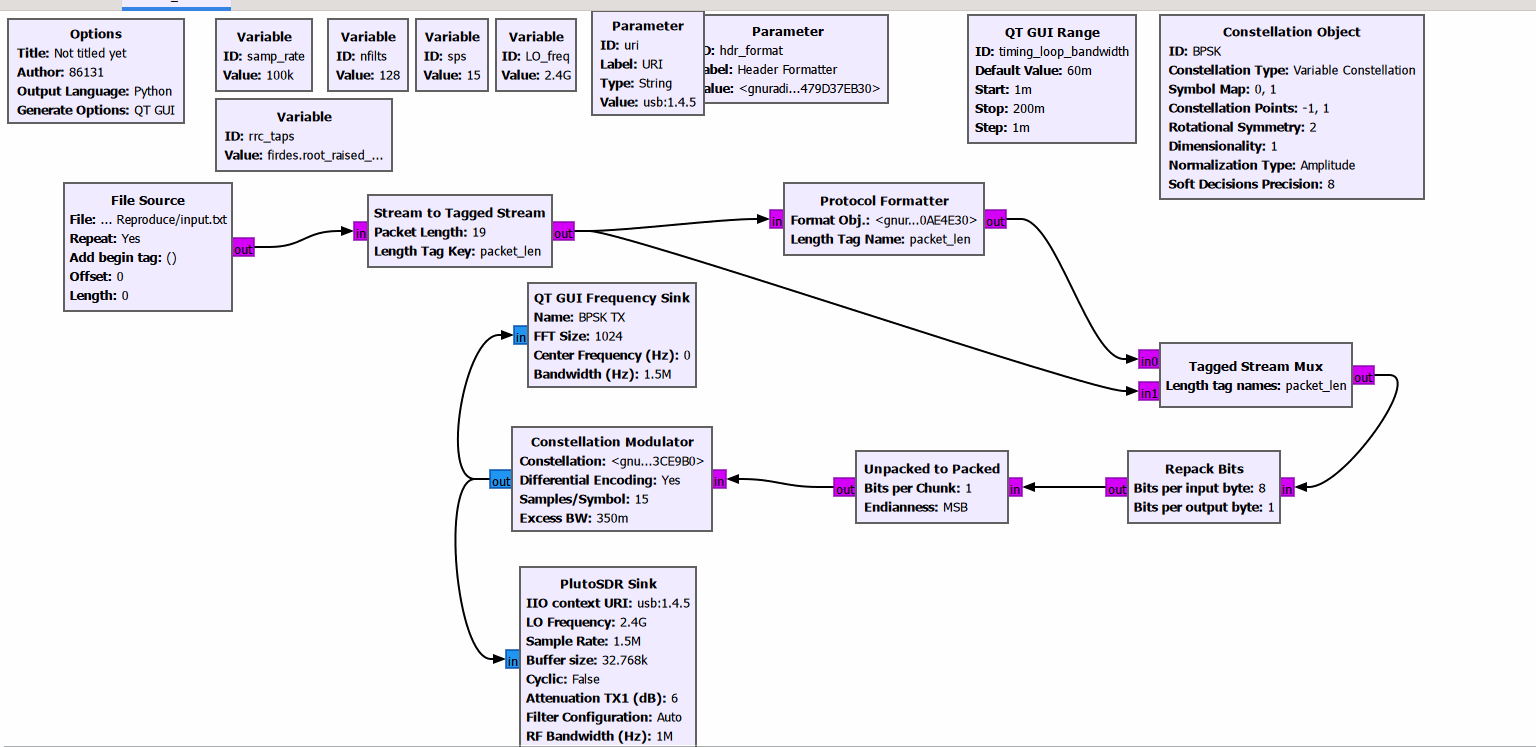
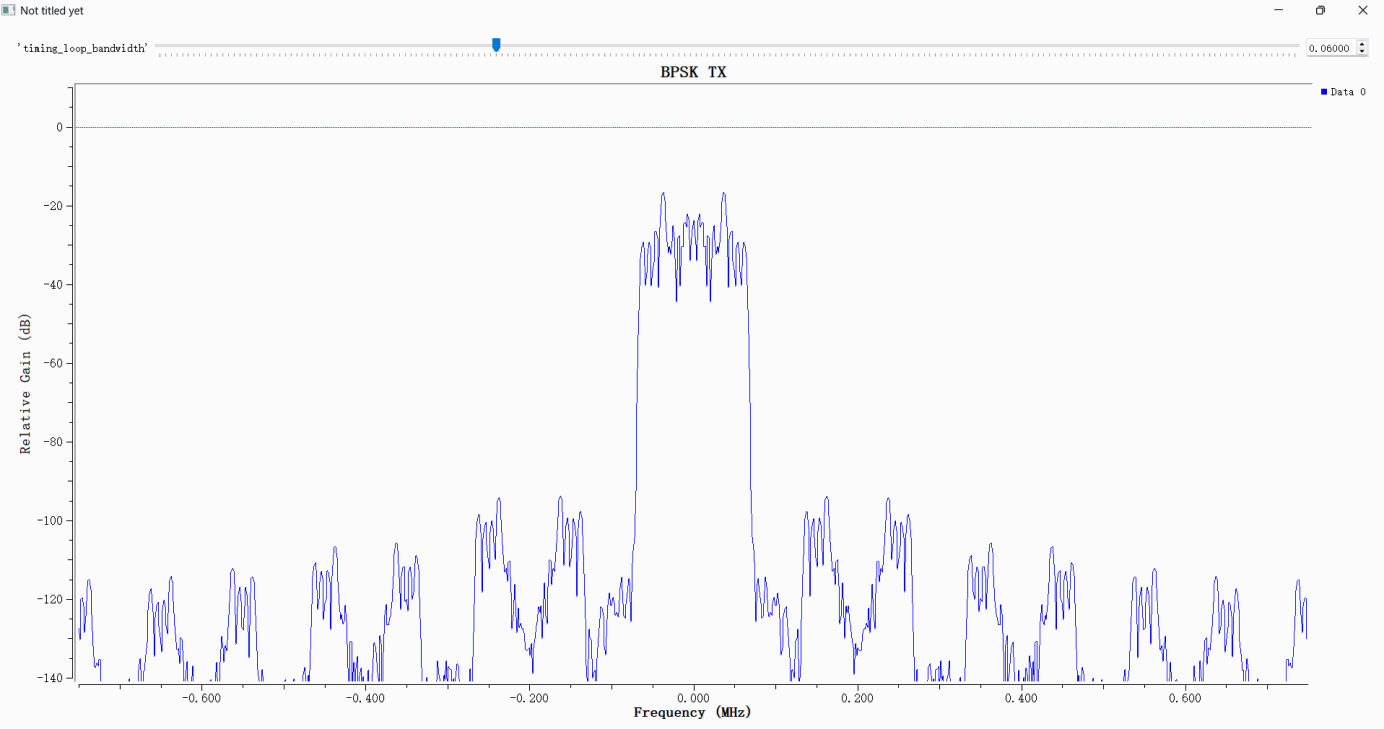
First, set the PlutoSky P1 as the transmitter, connect the device to the computer via a USB cable, and confirm that the device is recognized normally. This GNU Radio flowgraph implements the BPSK packet transmission chain for PlutoSDR hardware. The File Source block reads input.txt and transmits the data repeatedly. The Stream to Tagged Stream, Protocol Formatter and Tagged Stream Mux blocks perform frame encapsulation in sequence. The Repack Bits and Unpacked to Packed blocks rearrange the bit order. System parameters separate the symbol rate from the IQ sample rate: the symbol rate is 100 ksym/s, sps = 15, so the actual IQ sample rate at the PlutoSDR sink is 1.5 MS/s, and the LO frequency is 2.4 GHz. An RRC pulse-shaping filter with a roll-off factor of 0.35 is adopted. The BPSK block maps bit 0/1 to −1/+1 with differential encoding enabled. The modulated signal is routed to the QT GUI Frequency Sink for spectrum observation and to the PlutoSDR Sink, which transmits at a center frequency of 2.4 GHz over the USB/IIO interface. The attenuation of TX1 transmit channel is set to 6 dB.
Receiver and Demodulator
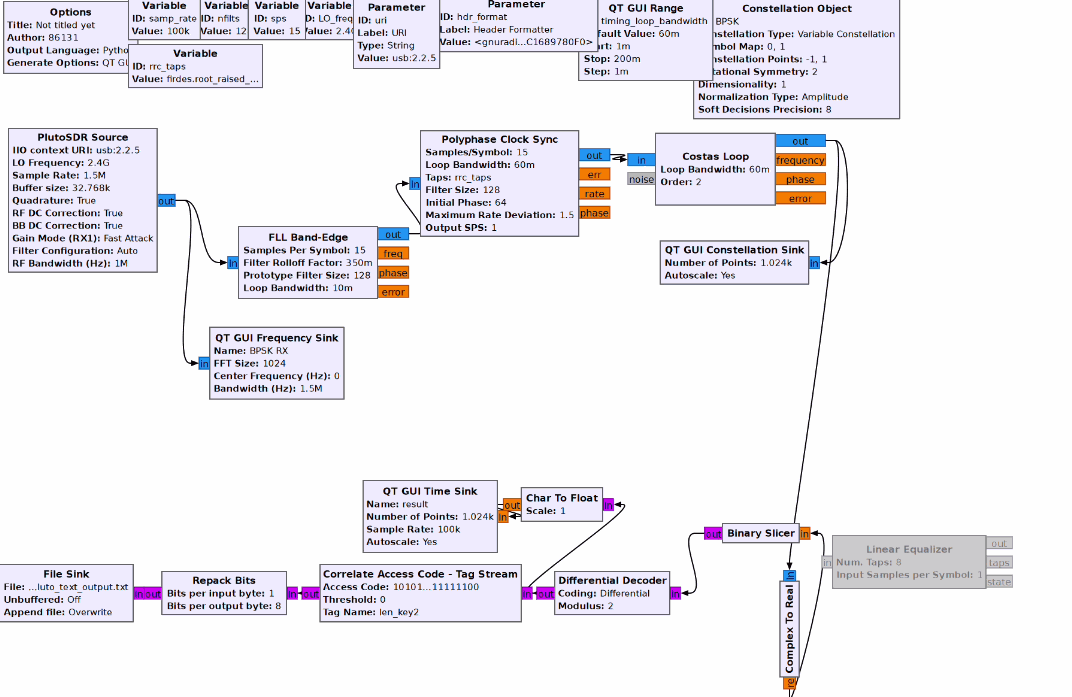
The receiver uses a separate PlutoSDR unit as the receiver. This receiver flowgraph uses PlutoSDR Source to capture the over-the-air signal in the 2.4 GHz band and convert it to complex baseband. One branch is sent to a QT GUI Frequency Sink for observing the baseband spectrum. The received signal first passes through FLL Band-Edge for coarse frequency-offset correction, then through Polyphase Clock Sync for matched filtering and symbol-timing recovery, and finally through a second-order Costas Loop for fine carrier synchronization.
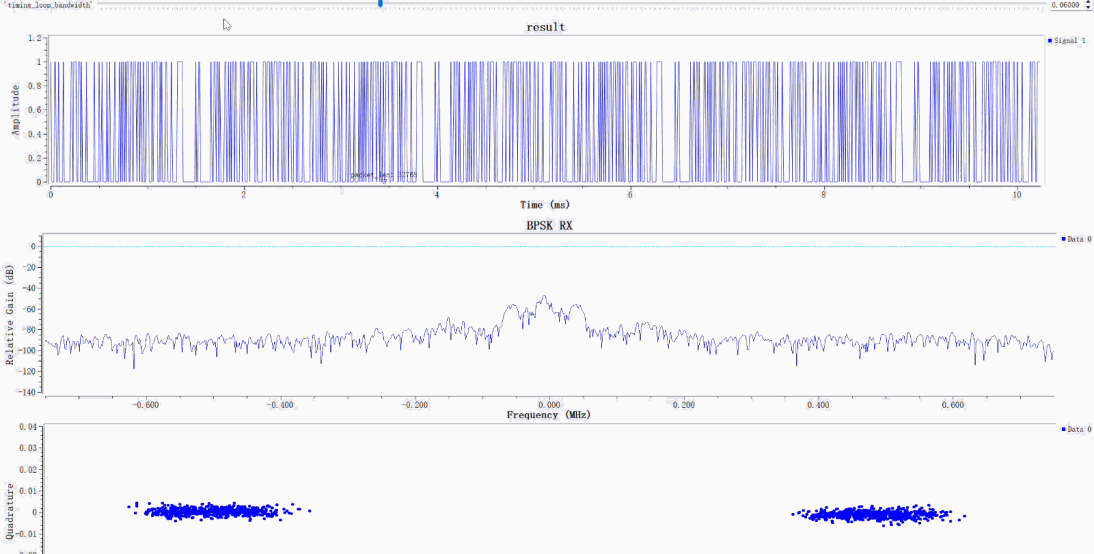
The receiver observation interface contains three views:
The top time-domain plot (result) shows the demodulated 0/1 bit waveform and packet tags. It only indicates that the flowgraph has produced candidate frames; correct file recovery must also be verified by comparing the input and output files or checking the CRC.
The middle spectrum plot (BPSK RX) shows the received signal spectrum. Its main energy is concentrated near the center frequency, allowing the spectral shape after propagation through the wireless channel to be observed.
In the bottom constellation plot, the points form two clusters on opposite sides of the real axis, which is characteristic of BPSK. However, the constellation alone cannot prove that the FLL, timing-synchronization loop, and Costas loop are all stably locked. The loop outputs, number of valid frames, bit-error rate, and input/output file consistency should also be checked.