GNU Radio ASK Modulation and Demodulation on PlutoSky P1
Learn ASK and OOK modulation, demodulation, and text transfer with GNU Radio, from software flowgraph simulations to PlutoSky P1 and PlutoSDR hardware.

Experimental Preparation and File Structure
Hardware Checklist
Transmitter
Receiver
Software Checklist
Experimental Files and Flow Graphs
All projects in this experiment are based on GNU Radio .grc flow‑graph files, which are divided into software simulation flow graphs and hardware measurement flow graphs. Simulation flow graphs generate and process signals purely via software signal sources without SDR hardware. Hardware flow graphs require the PlutoSky P1 / PlutoSDR RF devices to transmit and receive real RF signals. The functions, inputs and outputs of each flow graph are shown in the table below:
Principles of ASK Modulation
Principles of ASK Signal Modulation
There are two common forms of amplitude-shift keying modulation: On-Off Keying (OOK) and conventional Amplitude Shift Keying (ASK). Their core distinction is the carrier transmission state when the baseband logic symbol is “0”.
For OOK, it is a simplified special case of ASK. When the baseband signal carries a logic 0, the transmitted RF signal amplitude drops to zero, meaning no carrier waveform is sent at all. When the baseband signal is logic 1, a carrier wave with a fixed non-zero amplitude is transmitted.
For standard ASK, two different non-zero carrier amplitudes are assigned for the two logic states. When the baseband signal represents logic 0, the system still transmits a continuous carrier waveform with a constant non-zero amplitude, which is lower than the amplitude used for logic 1. Logic 1 corresponds to a higher carrier amplitude. In this way, the carrier signal is always present during symbol periods, regardless of whether the transmitted bit is 0 or 1.
Time‑domain Expression
Mathematical expression of the OOK signal
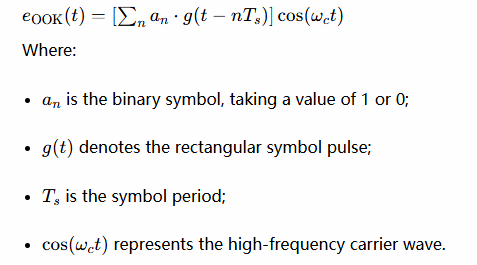
This formula corresponds to the Multiply block in GNU Radio simulation. The baseband bit stream is multiplied with the carrier to implement OOK modulation.
GNU Radio Simulation of OOK Signal Modulation
Flow Graph Opening and Verification
First, import the file ASK_mod.grc in GNU Radio. This flow graph is designed for baseband simulation of OOK/2ASK signals.
Open ASK_mod.grc to launch the OOK modulation simulation. A 10 kHz cosine wave serves as the simulation carrier, and a 1 kHz 0/1 square wave acts as the baseband modulating signal. After multiplication by the Multiply block, the carrier is output when the baseband value is 1, and zero is output when the baseband value is 0. In this way, the OOK modulated bandpass signal is generated. The Throttle block controls the simulation rate. The QT GUI Time Sink and QT GUI Frequency Sink display the time-domain waveform and spectrum respectively.
It should be noted that the 1 kHz square wave is only a simplified model of the periodic pattern 101010..., rather than a real random bit stream. The 1 kHz value refers to the square‑wave frequency and cannot be directly treated as the actual data rate.
This flow graph only uses software signal sources and display blocks; no hardware device connection is required.
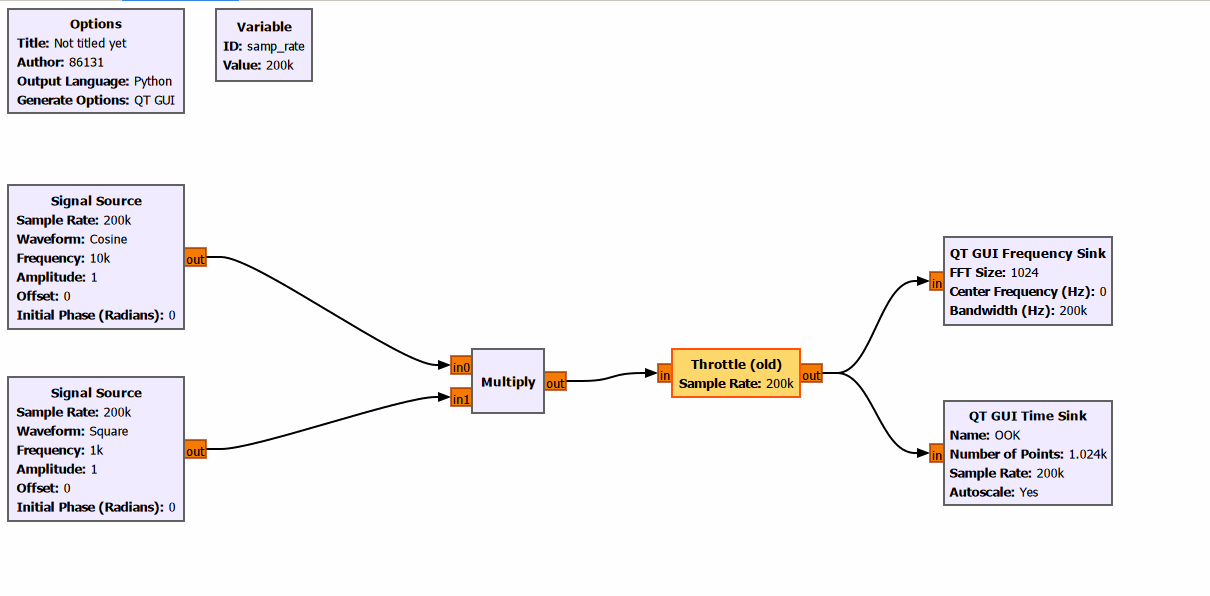
Flow Graph Execution and Analysis
Run the simulation, and the OOK modulated signal can be obtained.
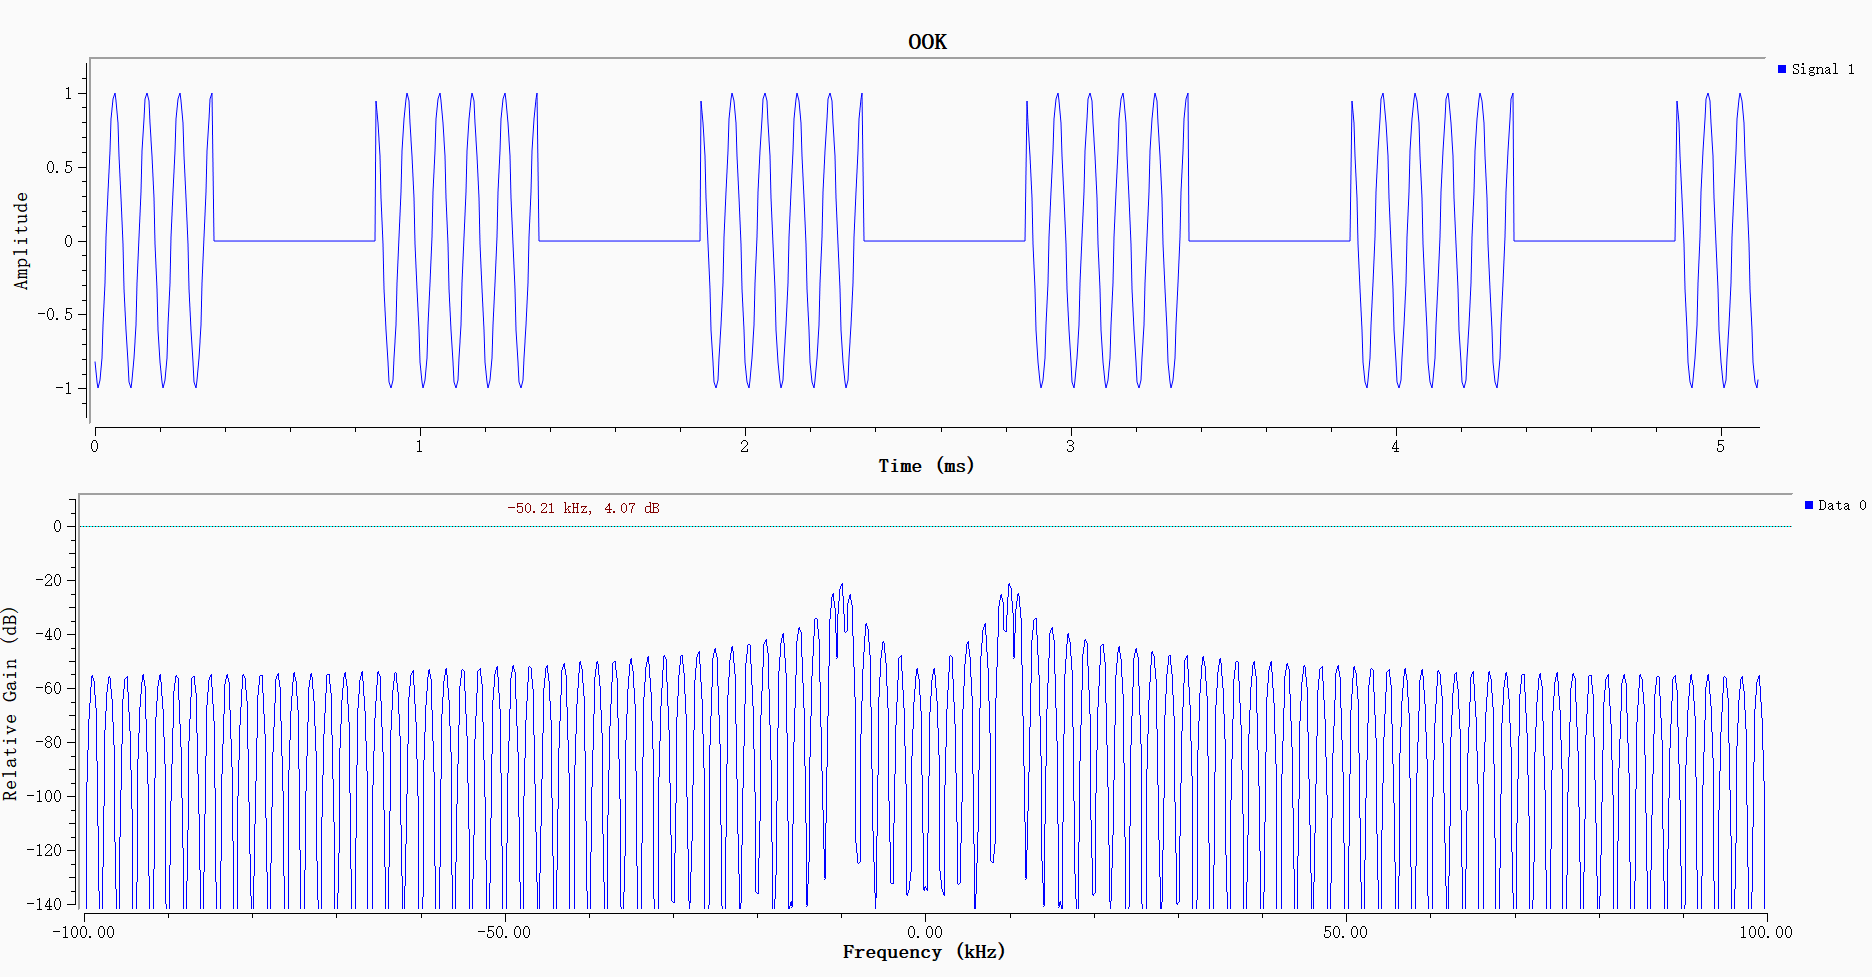
The upper time-domain plot shows the typical OOK waveform: the 10 kHz carrier can be observed during the high-level interval of the square wave, while the signal amplitude equals zero during the low-level interval. Since the high and low levels of the 1 kHz square wave each last approximately 0.5 ms, each carrier burst contains roughly 5 carrier cycles. The carrier appears only when the baseband signal is 1, which demonstrates that the modulation correctly implements on-off control of the carrier.
The lower frequency-domain plot shows the spectrum of the OOK signal. Since the input signal is real-valued, its spectrum is symmetric about 0 Hz.Spectral energy is concentrated near the ±10 kHz carrier. The nearest sidebands lie 1 kHz from the carrier on each side, and the outer sidebands are spaced roughly 2 kHz apart. As the square wave contains multiple odd harmonics, multiple sets of sidebands appear in the spectrum. Moreover, steeper square-wave edges lead to more prominent higher-order sidebands.
GNU Radio Simulation of OOK Signal Demodulation
Flow Graph Opening and Verification
Open ASK_mod_demod.grc. This flow graph implements non-coherent demodulation simulation for OOK signals.
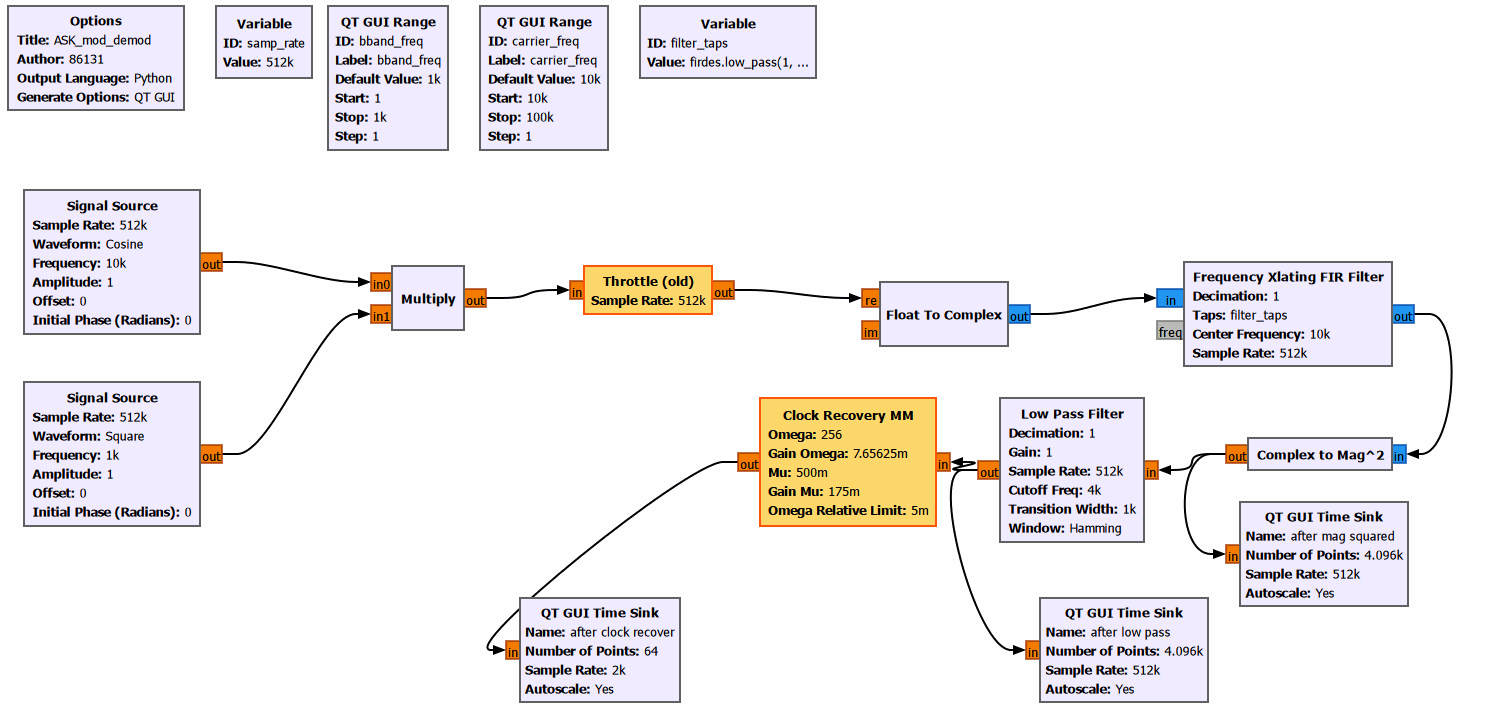
A 10 kHz cosine wave and a 1 kHz square wave are used as the carrier and baseband modulating signal, respectively. After passing through the Multiply, Throttle and Float to Complex blocks, the signal is fed into the Frequency Xlating FIR Filter. This block performs down-conversion and FIR filtering simultaneously, shifts the OOK modulated signal around the carrier to baseband, and suppresses out-of-band components. The signal then goes into the Complex to Mag² block for envelope detection, followed by a Low Pass Filter to remove high-frequency components and recover the low-frequency envelope signal. The output of the low-pass filter connects to both the QT GUI Time Sink and Clock Recovery MM block, for observing the demodulated envelope and performing symbol synchronization separately. This entire flow graph runs purely as software simulation, and no hardware connection is required.
Flow Graph Execution and Analysis
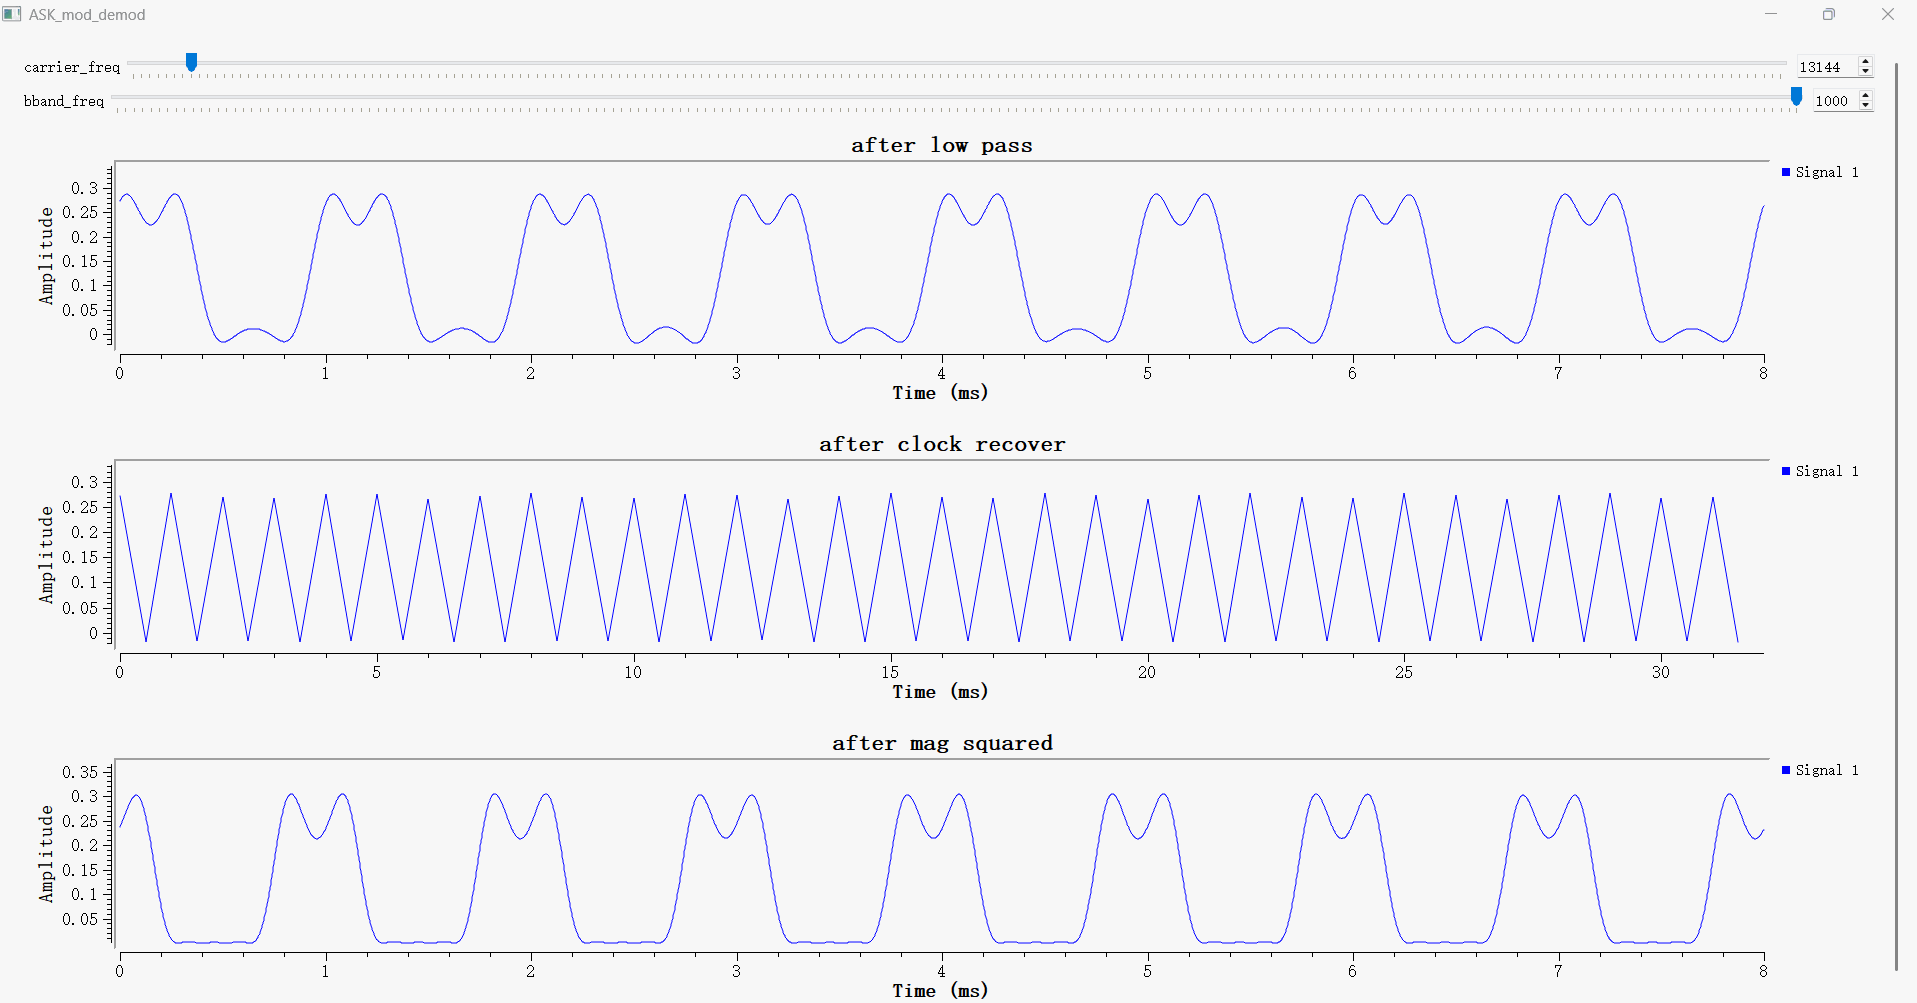
The upper waveform labeled after low pass is the envelope signal after low-pass filtering. The high-level interval corresponds to baseband symbol 1, and the low-level interval, close to zero, corresponds to baseband symbol 0. Therefore, this plot best illustrates the OOK demodulation result. Slight fluctuations in the high-level region arise because the low-pass filter retains some square-wave harmonics.
The middle waveform after clock recover shows discrete symbol samples after clock recovery. Omega = 256 means that each high or low level interval contains approximately 256 input samples. Since the high and low levels of the 1 kHz square wave each last 0.5 ms, one complete 1+0 period contains 512 samples. The clock recovery block outputs one sample at the optimal sampling instant of each symbol. QT GUI connects these discrete samples with straight lines, resulting in the triangular waveform shape.
The lower trace after mag squared is the intermediate signal after magnitude squaring, which still contains obvious high-frequency ripples and square-wave harmonics. These components are attenuated after low-pass filtering to produce the smooth envelope shown in the upper plot.
GNU Radio Simulation of ASK Text Transmission
Data Source and Flow Graph Opening
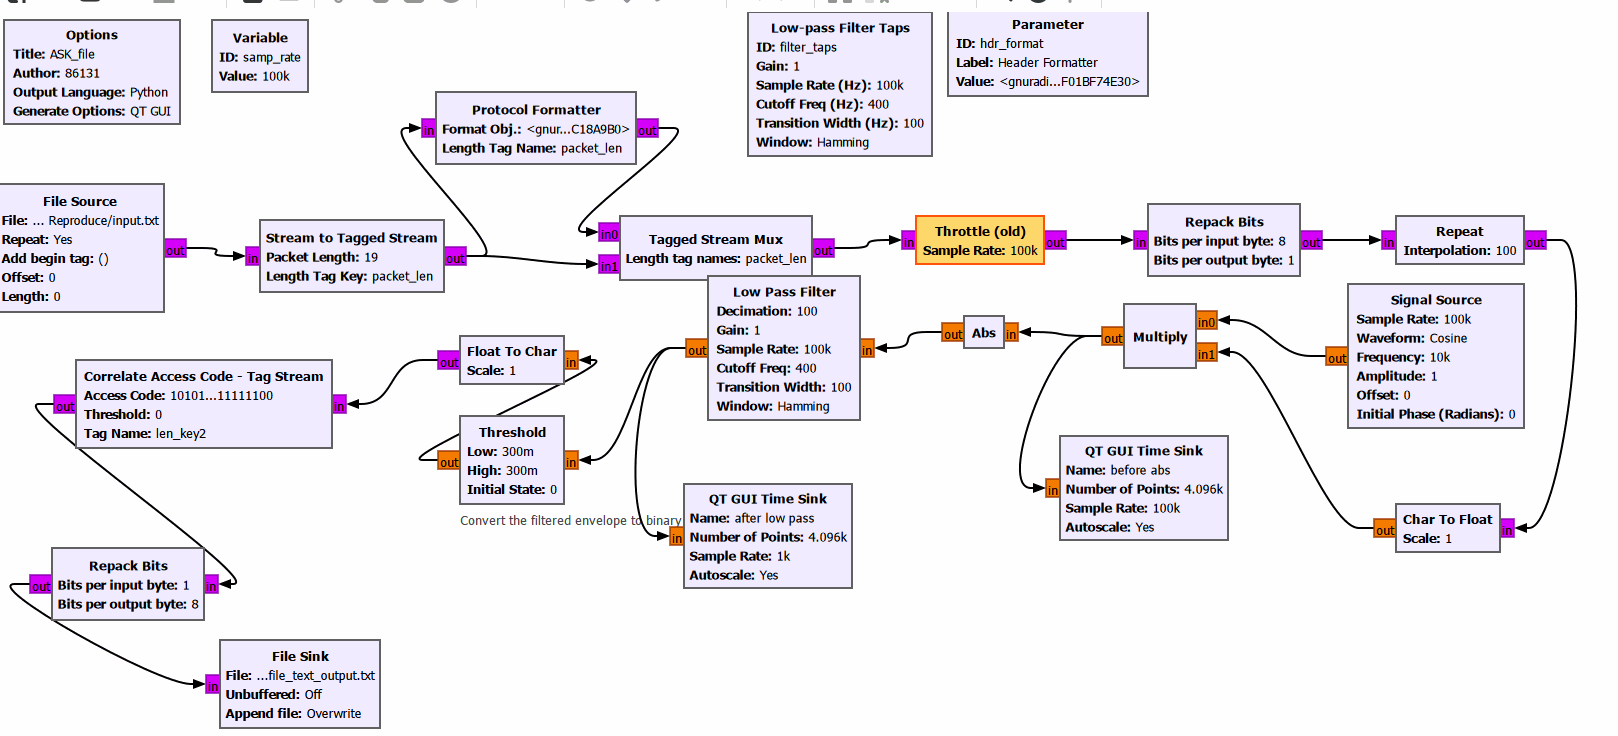
Open ASK_file.grc. This flow graph realizes OOK modulation, demodulation and recovery of text data. The File Source block reads input.txt. After framing, preamble insertion, byte-to-bit conversion and repeating each bit 100 times, the signal is multiplied with the 10 kHz carrier to generate the OOK modulated signal. At the receiver, the Abs block takes the absolute value of the OOK modulated signal to implement non-coherent envelope detection. A Low Pass Filter then removes high-frequency components, followed by decimation by a factor of 100 to recover the low-frequency envelope signal. Finally, the signal passes through the Threshold block, preamble correlation detection and bit reassembly. The original text is recovered and written to the output file.
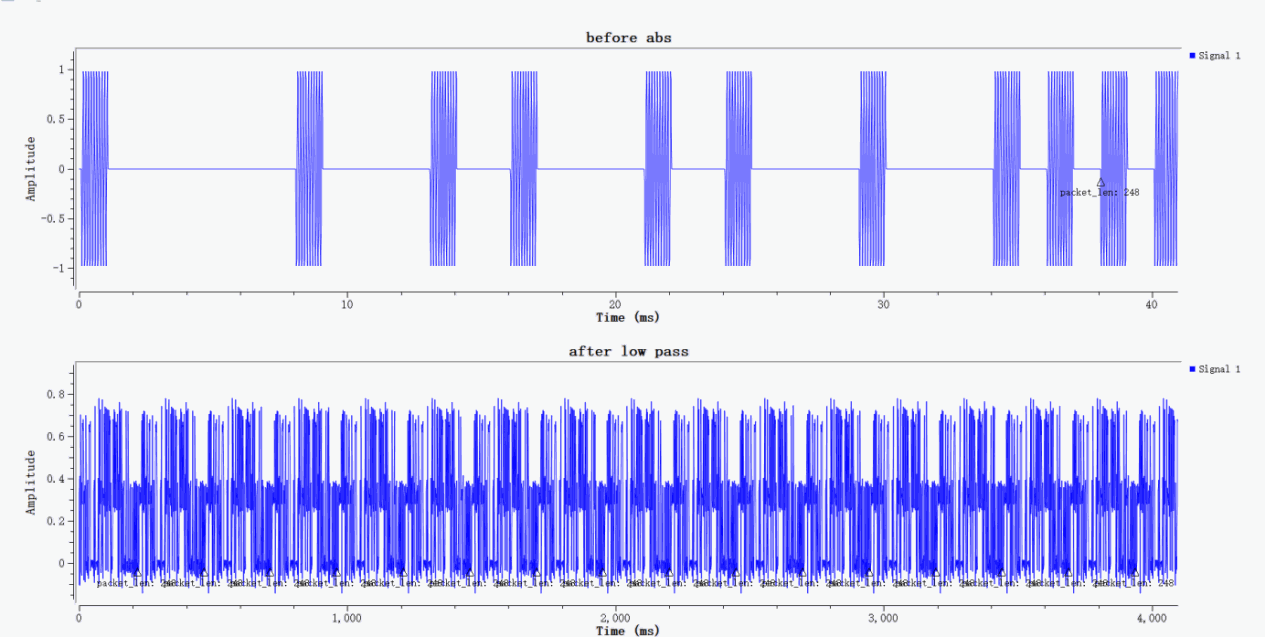
Modulation,Demodulation and Frame Synchronization
The upper waveform labeled before abs is the OOK modulated signal: bursts of carrier pulses represent bit "1", while blank intervals with amplitude close to zero represent bit "0". The marked packet_len:248 in the figure indicates that the packet tag has been successfully generated and attached to the data stream. The lower waveform after low pass is the baseband envelope waveform after absolute-value envelope detection and low-pass filtering. This QT GUI Time Sink is configured with a sampling rate of 1 kS/s and displays a total of 4096 samples, giving a total time span of approximately 4.096 s. It contains a large number of text bits, so the waveform appears dense visually. This is a normal phenomenon in the simulation.
ASK Text Transmission and Reception Based on PlutoSky P1
Flow Graph Opening and Verification
After completing the GNU Radio simulation, the PlutoSky P1 can be used to implement ASK text transmission and reception. In this experiment, one PlutoSky P1 device together with GNU Radio is adopted to transmit and receive text data, and the recovered text data is finally saved into a text file.
Transmission and Reception Workflow
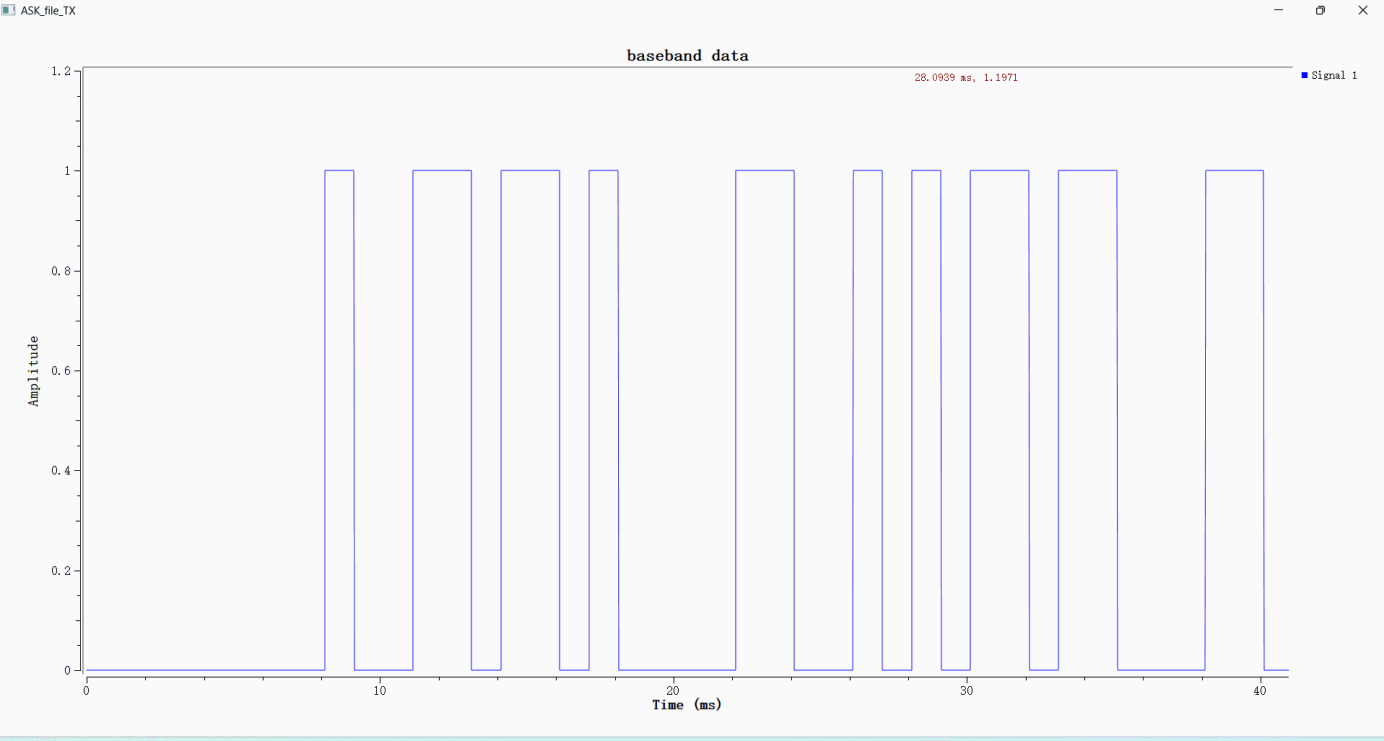
First, set the PlutoSky P1 as the transmitter and open the ASK_file_TX.grc file. The File Source reads text data. The Stream to Tagged Stream and Protocol Formatter blocks add packet tags and preambles, which are then combined by the Tagged Stream Mux block. The Repack Bits block converts bytes into bits, and the Repeat block extends each bit to 100 samples. Afterwards, the signal passes through Char to Float, an interpolating low-pass filter and Float to Complex, and is finally fed into the PlutoSDR Sink for transmission.
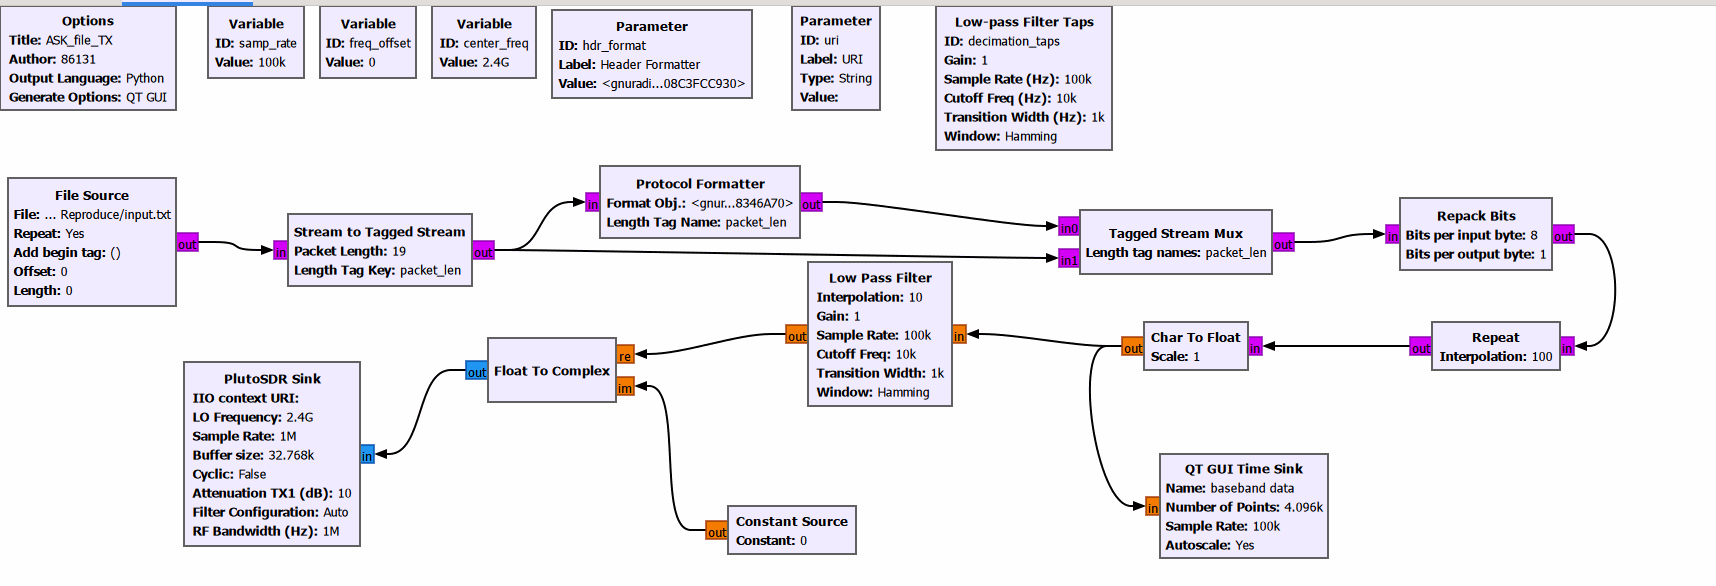
The plot labeled baseband data shows the 0/1 baseband symbol stream before transmission. The waveform consists of rectangular pulses, which indicates that the data conversion has been performed correctly.
Take another PlutoSDR as the receiver and open ASK_file_RX.grc.
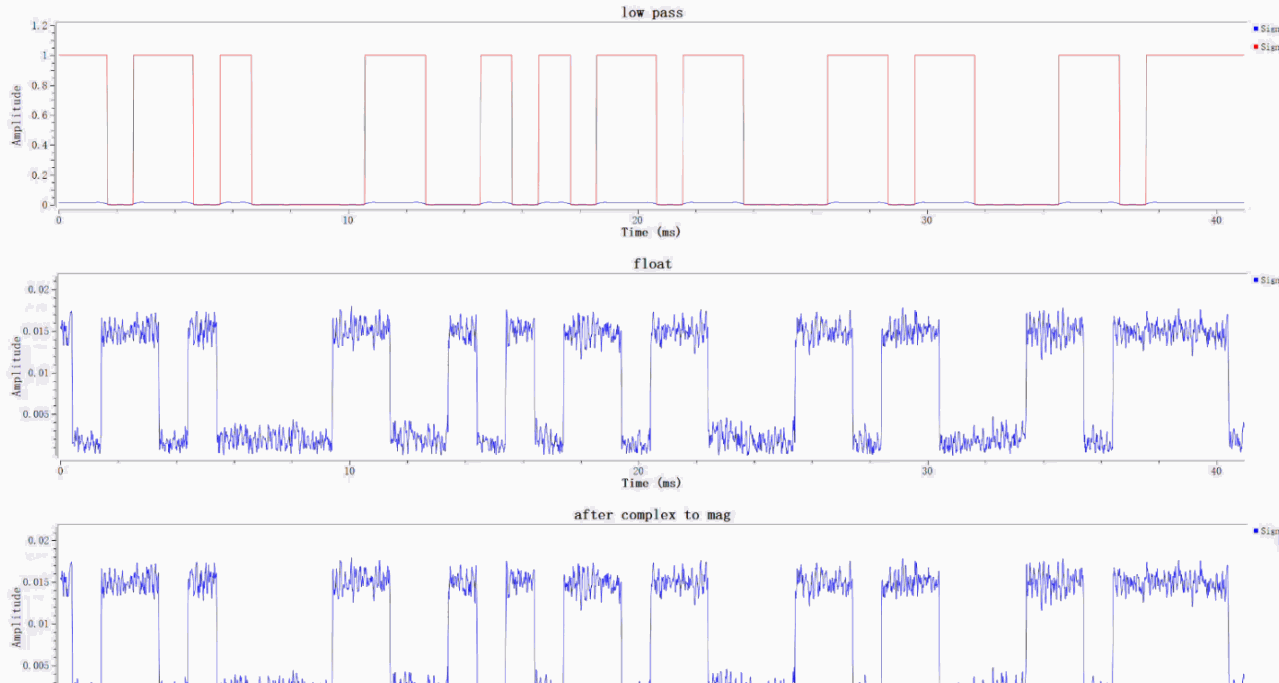
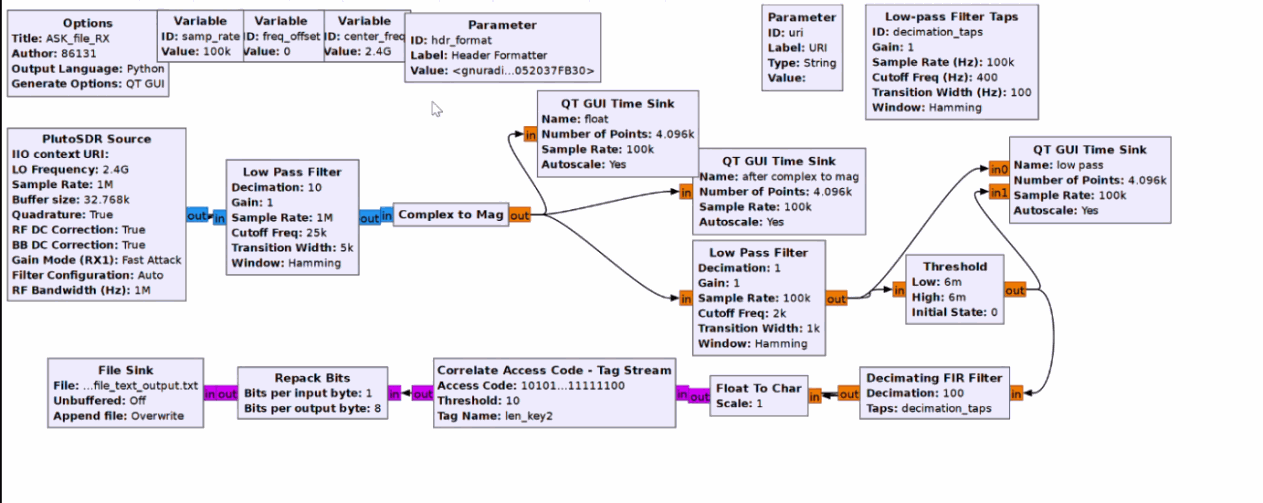
The PlutoSDR Source block captures the RF signal. The signal first undergoes low-pass filtering and decimation by a factor of 10. Then the Complex to Mag block calculates the magnitude of the complex signal to complete non-coherent envelope detection. Afterwards, a low-pass filter smooths out high-frequency ripples on the envelope, and the signal is fed into the Threshold block. This block converts the analog envelope into a 0/1 digital signal; the decision threshold is set to 0.006 in this experiment. The signal further passes through decimation filtering, Float to Char conversion, preamble correlation synchronization detection and Repack Bits bit reassembly. Finally, the original text is recovered and written to the output file.
Reception results: The middle and bottom waveforms are the envelopes obtained by taking the magnitude of the complex signal. The high level is approximately 0.015 and the low level is roughly 0.002. The red waveform at the top is the 0/1 baseband symbol stream output from threshold decision, indicating successful demodulation of the OOK signal. The two observation ports, float and after complex to mag, tap the same signal node, so their waveforms are identical. This is normal.