
GNU Radio FM Modulation and Demodulation on PlutoSky P1
Explore FM modulation, demodulation, and WFM audio transmission with GNU Radio and PlutoSky P1, including multi-tone simulations and RF loopback.

Experiment Preparation and File Structure
Hardware Checklist
Transmitter
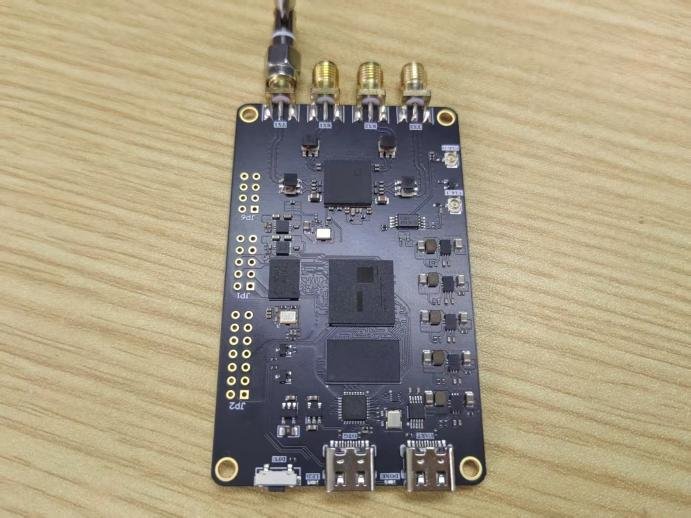
Receiver
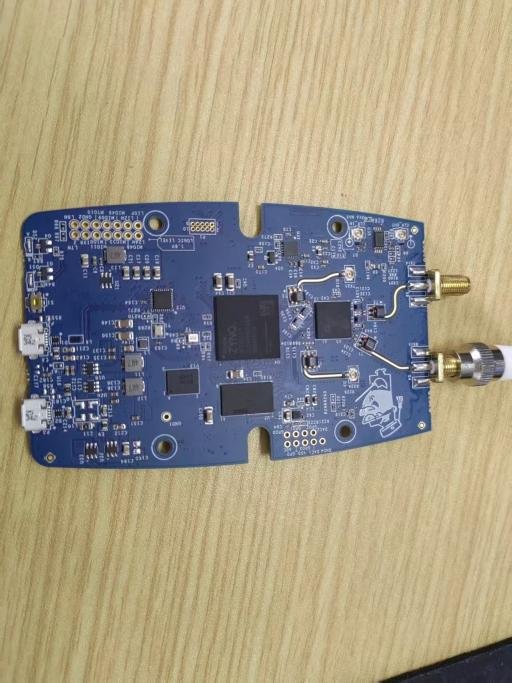
Software Checklist
Experiment Files and Flowgraphs

FM Modulation Theory
Principles of FM Signal Modulation
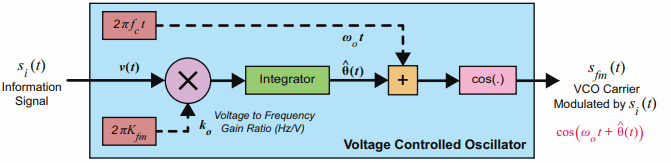
FM (Frequency Modulation): Information is carried by the instantaneous frequency of the carrier wave. The instantaneous frequency of the carrier rises with the amplitude of the baseband message signal and falls as the baseband amplitude decreases. The Voltage-Controlled Oscillator (VCO) is the basic device for FM modulation; its output oscillation frequency varies with the input control voltage.
1.Modulation principle: The baseband signal fed into the VCO is scaled by FM gain and integrated to obtain the instantaneous phase, which generates the FM signal.
2.Single-tone FM: The baseband is a single-frequency sine wave. Define maximum frequency deviation ∆f and then integrated to obtain the instantaneous phase∆f. The modulation index 𝛽𝑓𝑚 =∆𝑓/fi (ratio of frequency deviation to the frequency of the baseband modulating signal). The modulation index is the key parameter to distinguish narrowband FM and wideband FM.
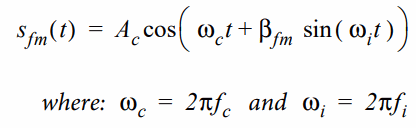
3.Multi-tone FM: The baseband consists of multiple superimposed frequency components. Modulation produces numerous sideband components. Sideband energy decreases as the offset from the carrier center frequency increases.

4.Narrowband FM (NFM) and Wideband FM (WFM)
NFM: Small modulation index, narrow signal bandwidth, commonly used in amateur radio.
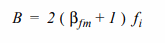
WFM: Large modulation index. Commercial FM broadcasting in China (88MHz~108MHz) is wideband FM with a standard maximum frequency deviation of 75kHz. Theoretically, FM generates infinitely many sideband components, yet components far from the carrier carry negligible energy and can be ignored in engineering. In engineering practice, Carson’s rule is used to estimate the WFM bandwidth, calculated with the highest baseband frequency 𝑓h.
Modulation Process
1.Input the message signal (single-tone / multi-tone audio baseband signal). The signal is amplitude-scaled by the FM gain coefficient Kfm to obtain the voltage-frequency control quantity.
2.Feed the scaled control quantity into the integrator module for integration. The output is the instantaneous phase deviation of the carrier.
3.Superimpose the phase deviation on the base carrier phase to construct the total instantaneous phase that dynamically changes with the baseband signal.
4.Send the total instantaneous phase to the cosine function block to generate the sinusoidal carrier signal. The carrier amplitude remains constant, and the instantaneous frequency varies with the amplitude of the baseband signal, which completes FM modulation.
5.For multi-tone baseband signals, combine multiple single-tone signals to form a composite baseband first. Then repeat the above steps of scaling, integration, phase superposition and waveform generation to produce the multi-tone FM modulated signal.
6.Differentiate NFM and WFM by the modulation index. Apply Carson’s rule to estimate the occupied bandwidth of the modulated signal and assess the risk of spectral broadening and adjacent-channel interference.
Wideband FM (WFM) Modulation Simulation
Flowgraph Opening and Verification
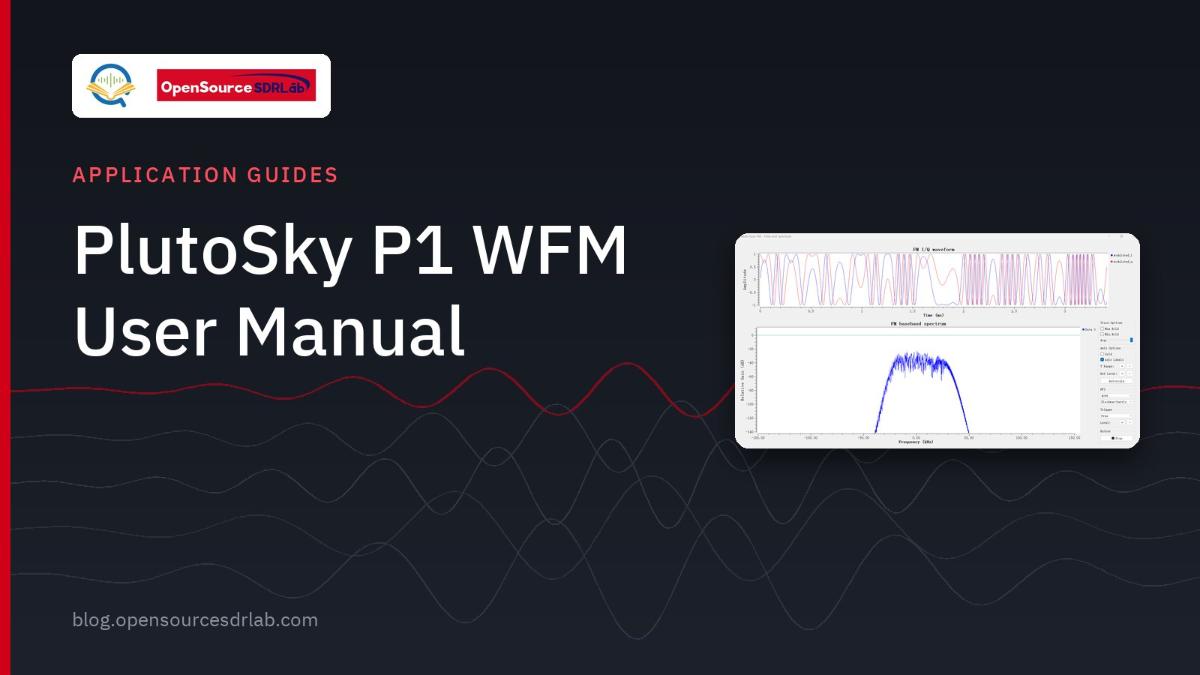
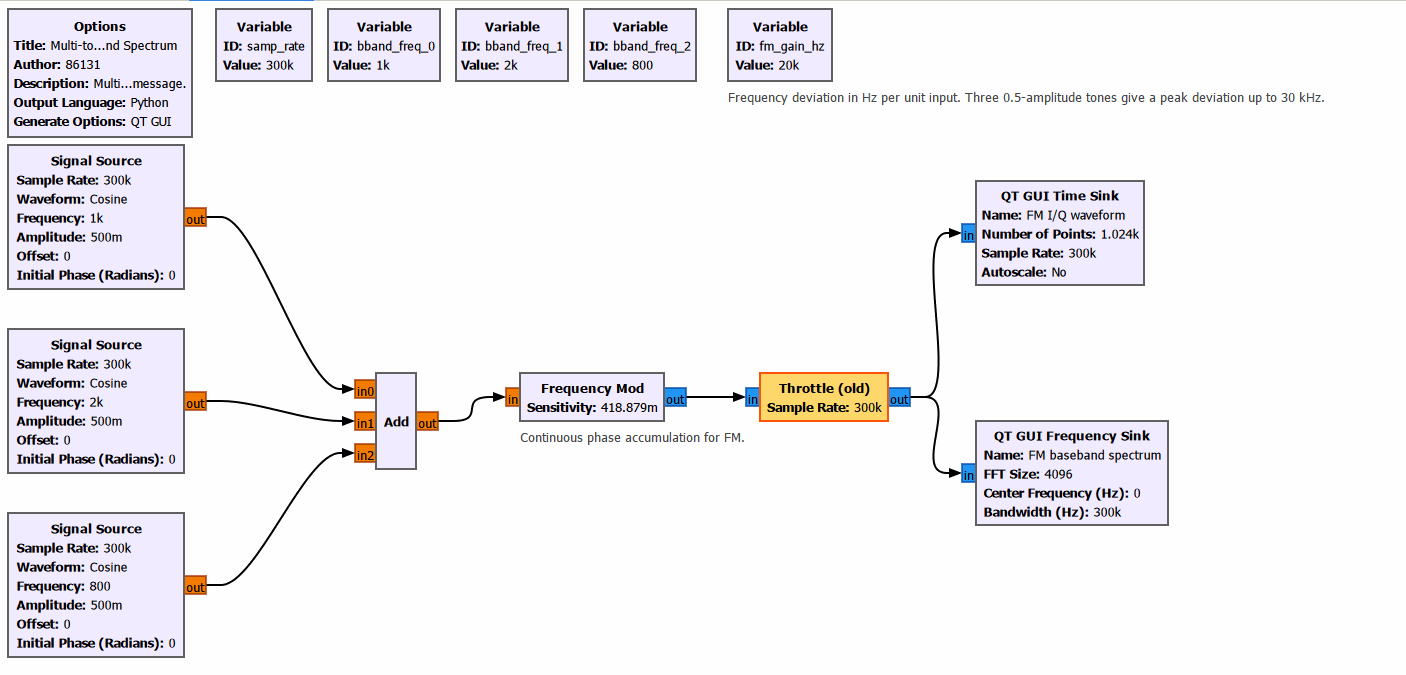
Open WFM_mod.grc in GNU Radio. This flowgraph is a baseband simulation chain for WFM wideband FM. Three cosine single-tone signals with different frequencies are used as simulated audio sources. They are linearly summed via the Add block to generate a composite audio baseband signal. The composite baseband feeds into the Frequency Mod block. Phase accumulation is performed by integrating the baseband signal to realize wideband FM, and complex FM baseband I/Q signals are output. The Throttle block controls the simulation rate. QT GUI time-domain and frequency-domain sink blocks are used to view the modulated I/Q waveforms and spectral broadening characteristics in real time for WFM modulation simulation verification.
No hardware device connection is required.
Flowgraph Execution and Analysis
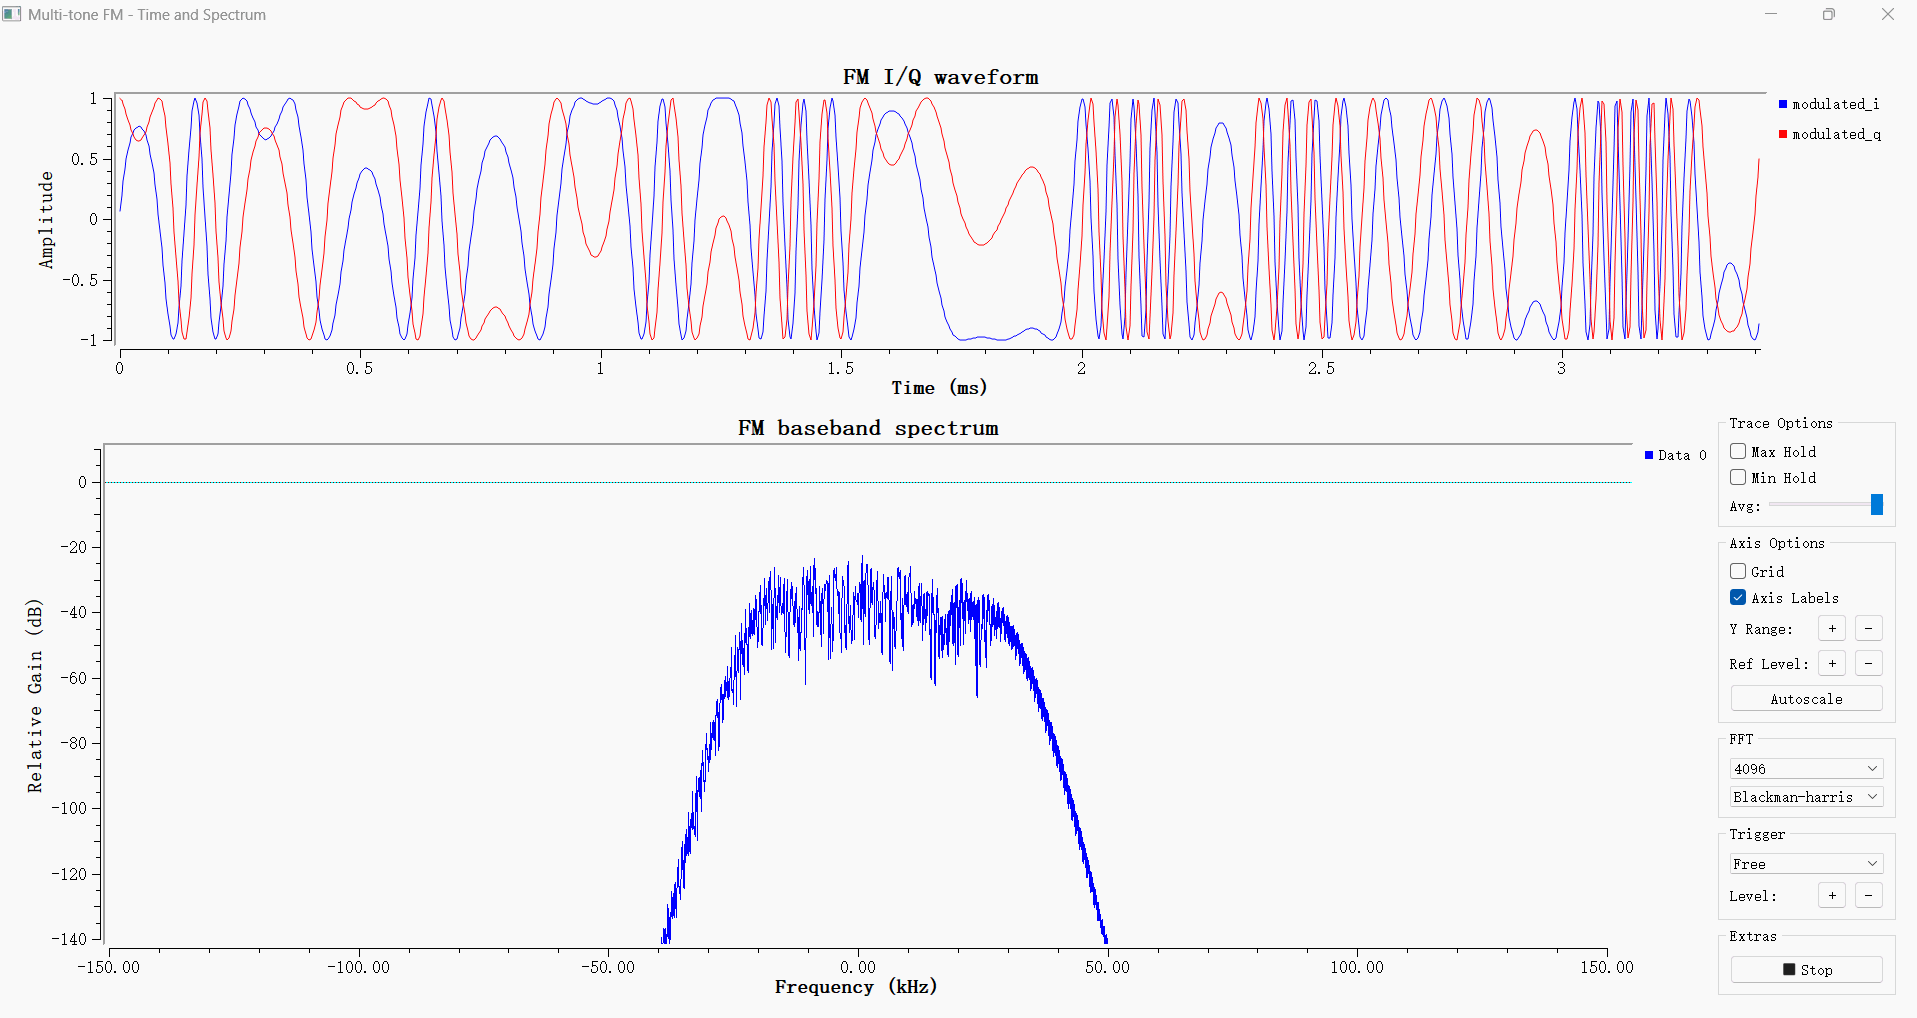
The simulation result is correct. In this experiment, three cosine signals at 800 Hz, 1000 Hz and 2000 Hz are summed before FM modulation. The sampling rate is 300 kHz, the amplitude of each tone is 0.5, and the peak frequency deviation is approximately 30 kHz.
The blue and red curves in the upper plot represent the I and Q components of the modulated signal, respectively. The oscillation density of the waveform varies over time, which indicates that the instantaneous frequency is controlled by the composite message. The magnitude of the complex signal combined from the two components remains constant.
The spectrum shown in the lower plot is mainly concentrated near the zero frequency, with multiple sidebands and combination frequencies. Given a peak frequency deviation of 30 kHz and a maximum message frequency of 2 kHz, the main bandwidth estimated by Carson’s rule is about 64 kHz. This value is not a hard cutoff boundary, so weaker spectral components can still be observed on both sides, which is normal.
Wideband FM (WFM) Demodulation Simulation
Flowgraph Opening and Verification
Open WFM_demod.grc in GNU Radio. The signal source generates a 1 kHz cosine baseband signal and splits into two paths. One path feeds the original baseband reference waveform directly into the time-domain sink block; the other path passes through the frequency modulation block to produce the FM baseband modulated signal. The modulated FM signal then enters the demodulation chain. The demodulation chain adopts the complex-conjugate differential frequency discrimination scheme: the FM signal is delayed by one sample and complex-conjugated, then multiplied with the original FM signal to extract the phase for frequency discrimination. The frequency-discriminated output passes through a low-pass filter to remove high-frequency noise and recover the baseband signal. The QT GUI time-domain window can simultaneously compare the original baseband signal and demodulated recovered waveform to verify the FM modulation and demodulation principle via simulation.
No hardware device connection is required.
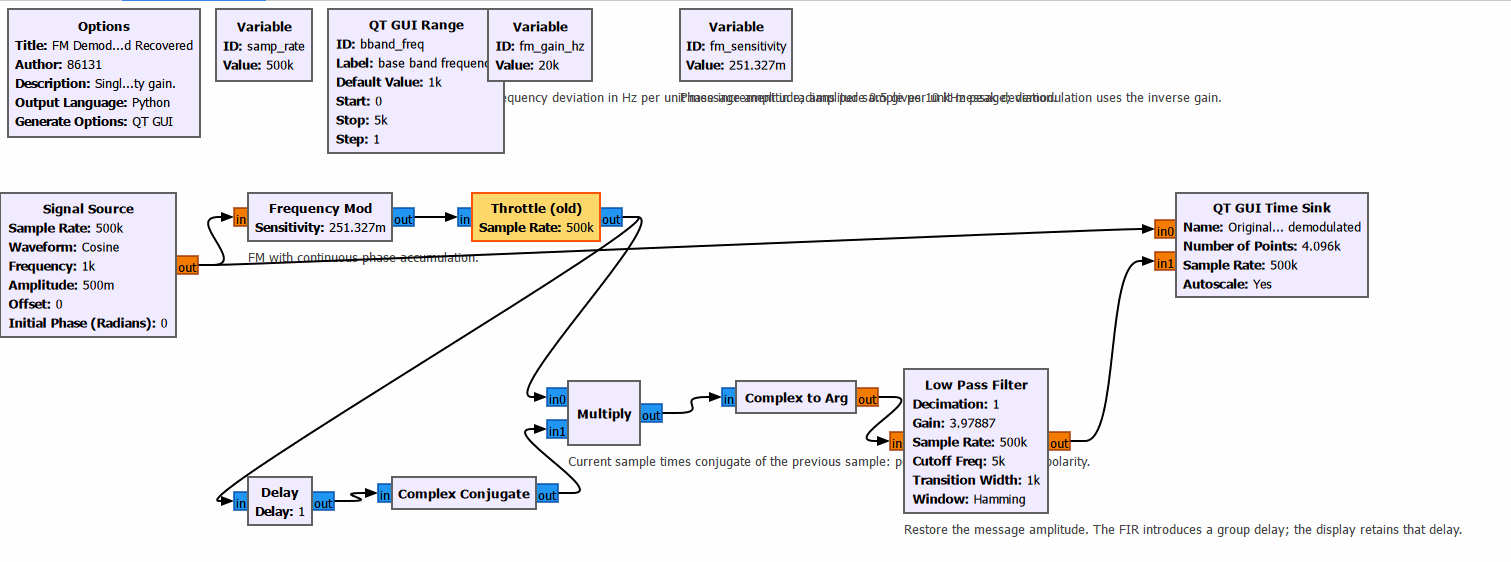
Flowgraph Execution and Analysis
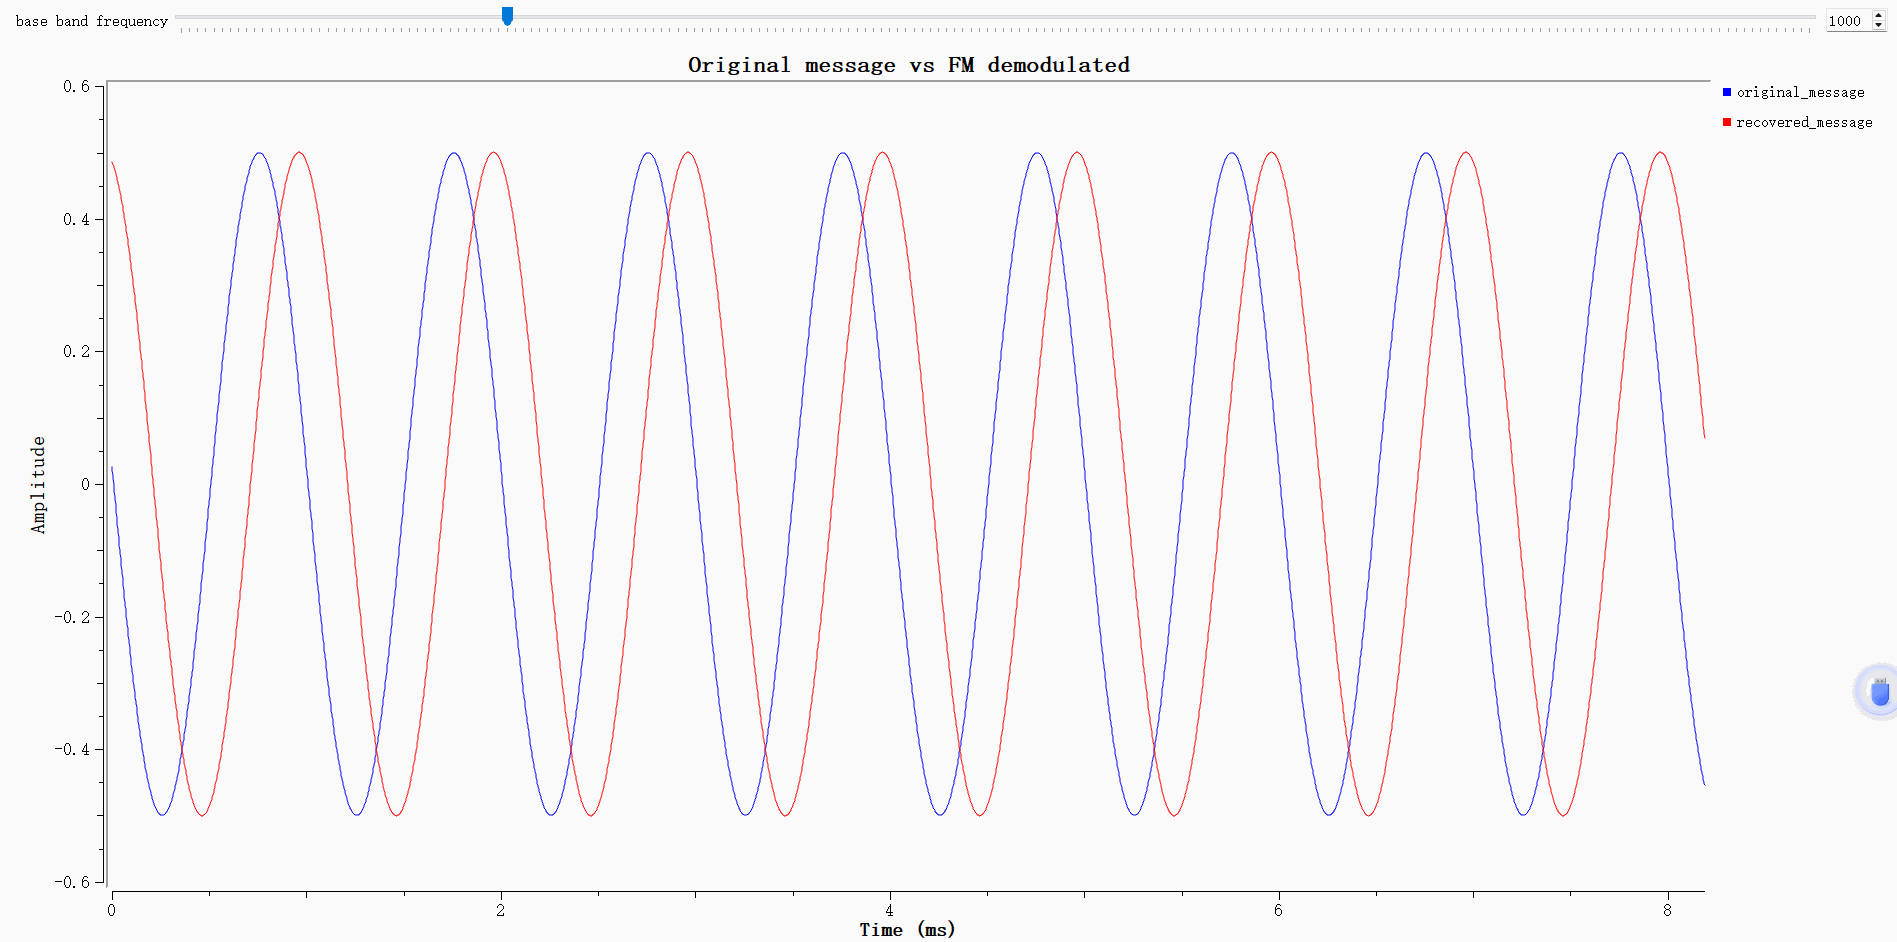
The blue curve represents the original message, and the red curve represents the recovered message. Both curves have a period of approximately 1 ms and an amplitude of about 0.5, indicating that the demodulation correctly recovers the frequency and amplitude of the message.
The red curve has a time offset relative to the blue curve. This is a normal effect caused by roughly 1.204 ms delay introduced by the low-pass filter. After delay compensation, the two waveforms nearly overlap, which shows that the current FM modulation and demodulation chain works properly.
WFM Audio Transmission and Reception Based on PlutoSky P1
After completing the GNU Radio simulation verification of wideband FM (WFM) signals, the PlutoSky P1 hardware platform can be used to implement wireless transmission and reception of WFM signals. The WFM modulated signal is transmitted in the FM broadcast band, and other SDR receivers or commercial FM radios can be used to demodulate the WFM broadcast signal and play back the audio.
Flowgraph Opening and Verification for Transmitter
Connect the computer and the device with a USB cable. When the virtual disk pops up, it means the computer has successfully recognized the device.
Use PlutoSky P1 as the transmitter and open the file WFM_tx_Pluto.grc.
This WFM_tx_Pluto.grc flowgraph is an over-the-air WFM transmission link based on PlutoSky P1. A 48 kHz mono WAV audio file is used as the modulation source. The audio signal passes through a throttle block first, then two stages of interpolating low-pass filters perform 20× upsampling to raise the sample rate to 960 kHz. The filters also limit the audio bandwidth and eliminate image interference generated by interpolation. The upsampled audio baseband is fed into the Frequency Mod block for wideband FM modulation to generate the complex WFM baseband signal. One copy of the modulated signal connects to the QT GUI spectrum sink for signal monitoring; the other is sent to the PlutoSDR Sink block. The hardware upconverts the baseband signal to the 433 MHz RF band to transmit the WFM signal over the air.
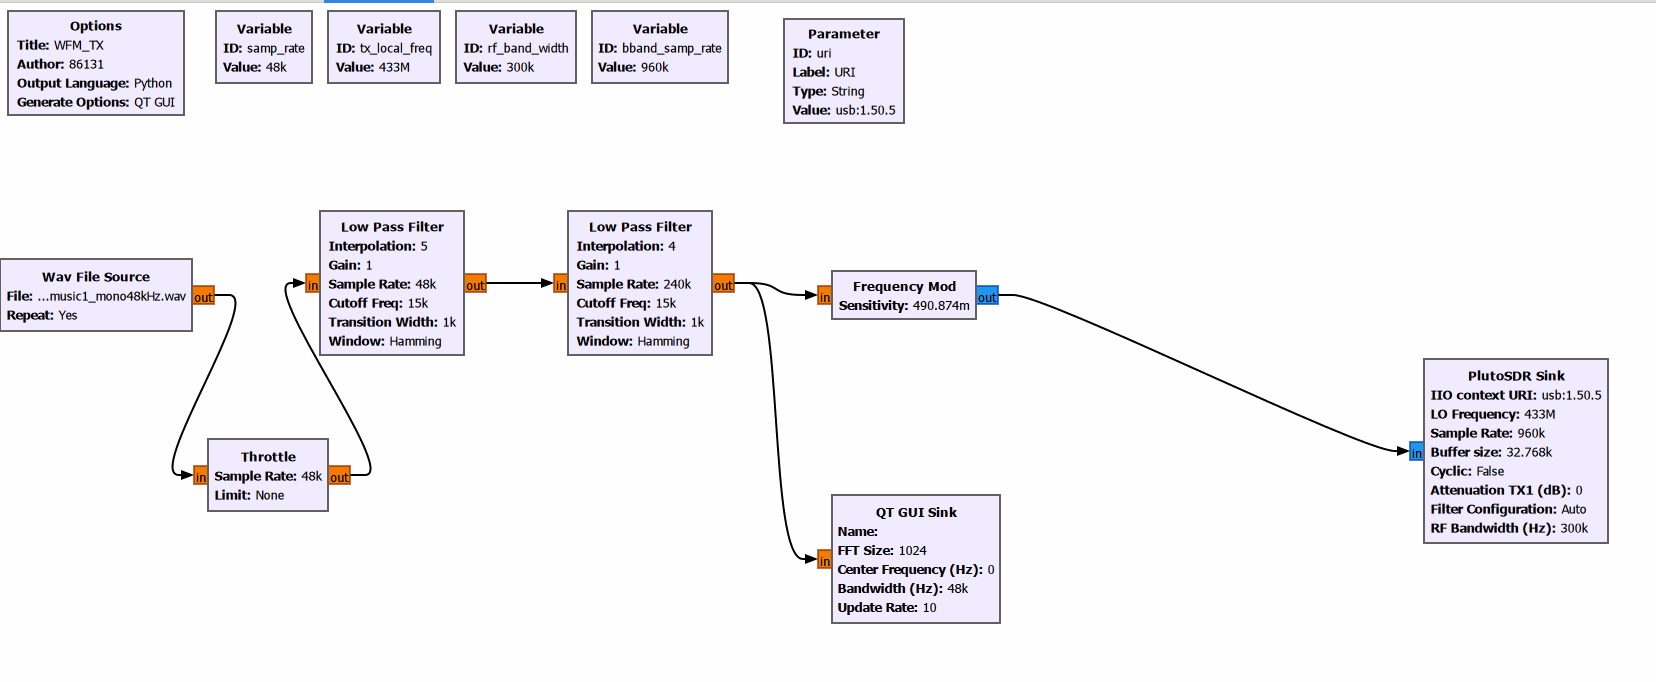
To obtain the correct IIO device URI address required by the PlutoSDR Sink block: Open CMD terminal under Windows system, or the native terminal under Linux / macOS system. Execute the shell command iio_info -s. The returned device information contains the usable USB‑based or network‑based IIO URI for the transmitter‑side PlutoSky P1 hardware.

Click Play to run the flowgraph. The figure below shows the frequency-domain plot of the transmitter signal.
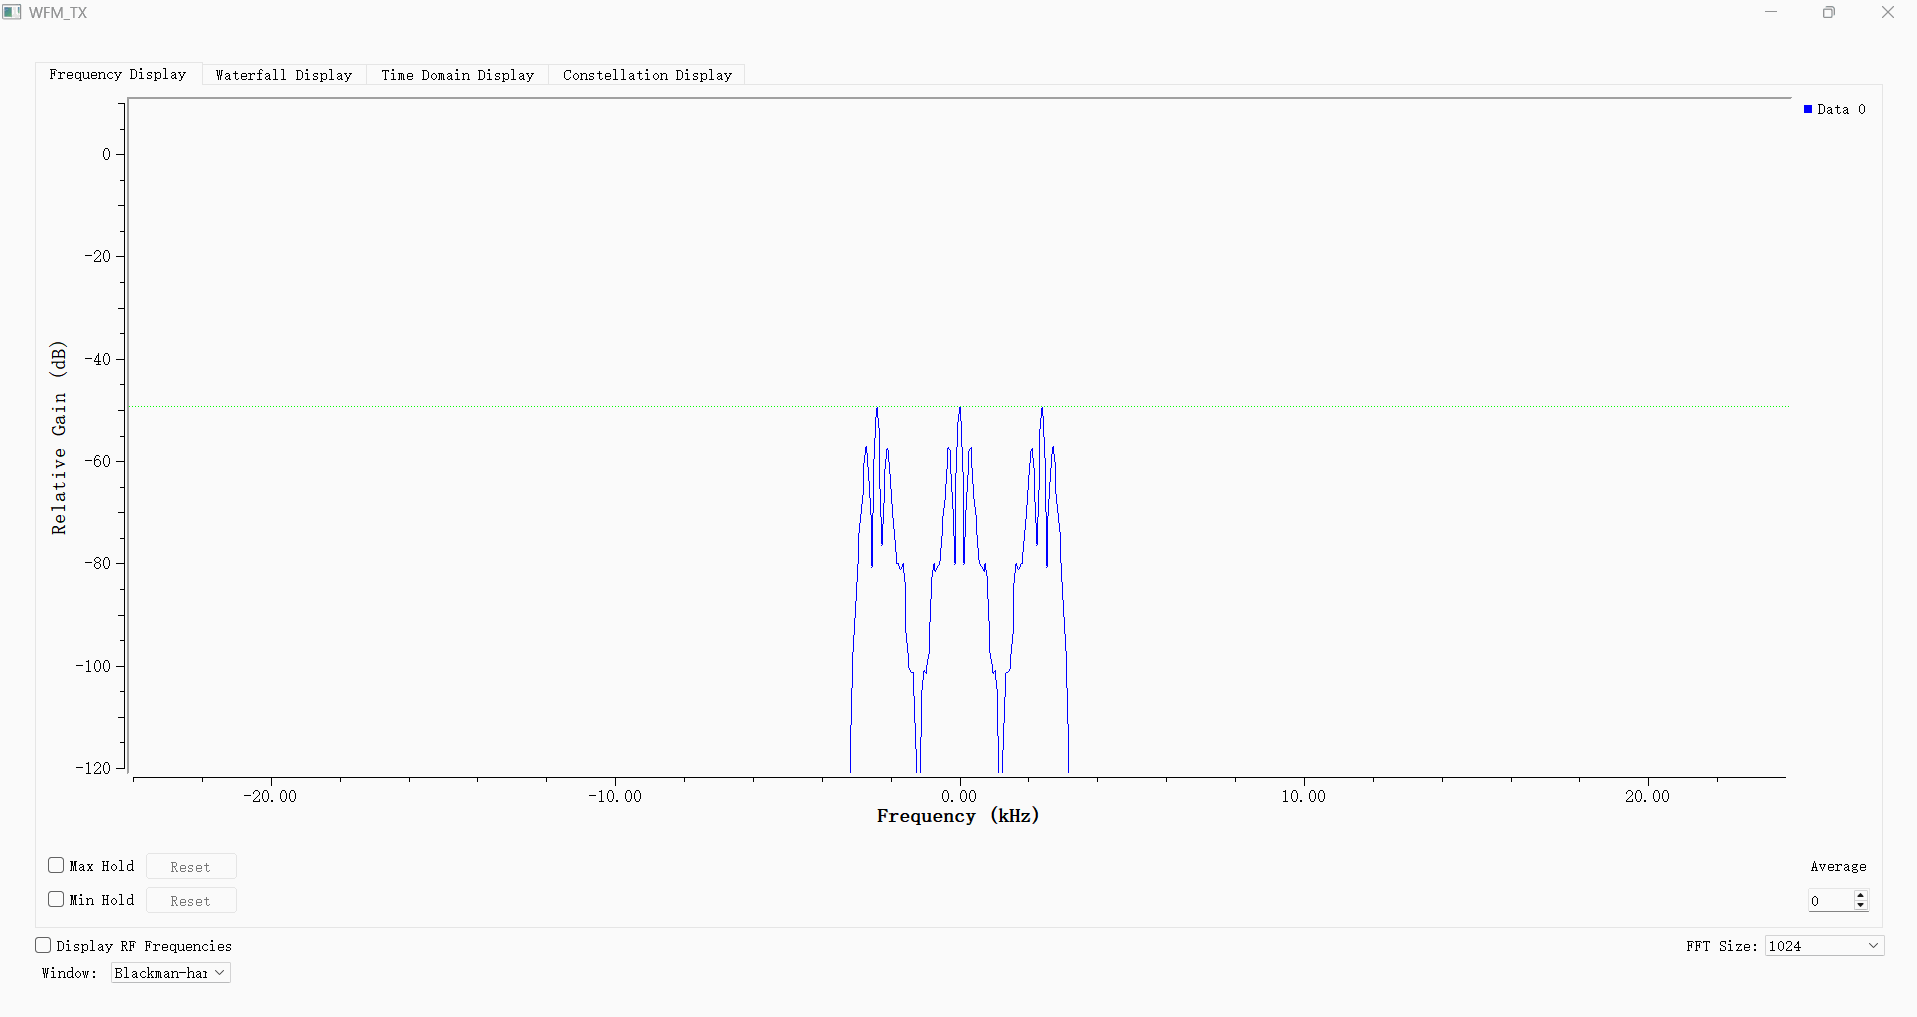
Receive Flowgraph and Analysis
Use another PlutoSDR device as the receiver and open the WFM_rx_Pluto.grc file.
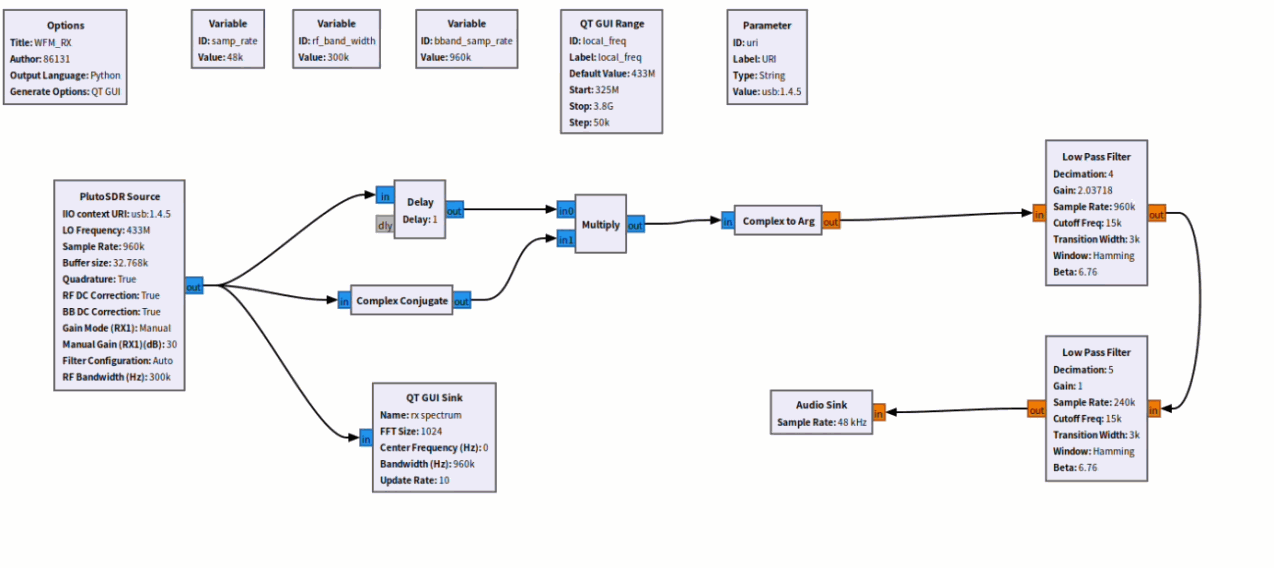
WFM_rx_Pluto.grc is the WFM wideband FM reception and demodulation flowgraph, which receives signals transmitted by the WFM_tx_Pluto.grc transmit flowgraph. The PlutoSDR receives the over-the-air 433 MHz RF WFM signal. A differential frequency discrimination (PLL-free complex-conjugate frequency discrimination) demodulation scheme is adopted to complete signal downconversion, FM demodulation and decimation filtering. Finally, the audio is recovered and played via the sound card.
Run iio_info -s to view the network-based IIO URI.

Start the flowgraph and begin signal reception.
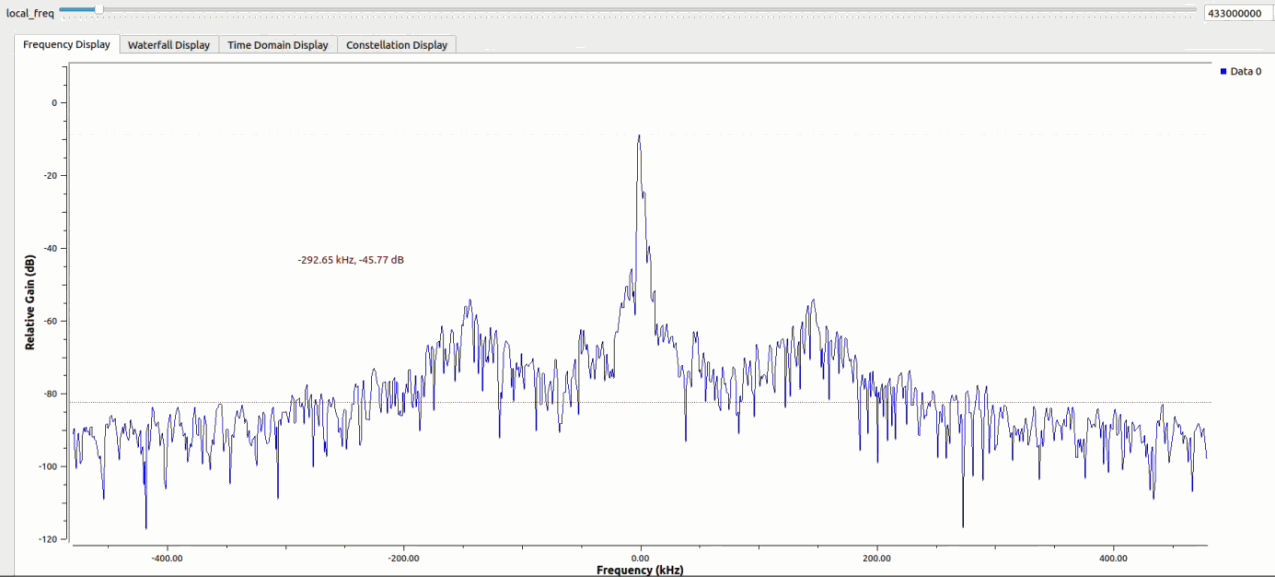
It can be seen from the spectrum that the receiver successfully captures the over-the-air WFM signal. The main peak of the WFM signal and FM sidebands appear at the center, and the signal power is higher than the system noise floor. Adjust the local_freq LO slider to align the main signal peak with the spectrum center to complete carrier frequency alignment. The subsequent demodulation chain can then recover the audio signal.
WFM Single-Device RF Loopback Transmit-Receive Experiment Based on PlutoSky P1
This experiment is a single PlutoSDR RF loopback transmit-receive test. Connect antennas to the TX and RX ports of the device respectively, then open the WFM_tx_rx_Pluto.grc project for testing. The flowgraph is built in GNU Radio to implement integrated WFM wideband FM transceiver functions. It consists of two signal paths:
The upper path is the transmit chain: the audio waveform file undergoes two-stage interpolating upsampling and low-pass filtering, then feeds into the frequency modulation block to generate the WFM baseband signal. Finally, the PlutoSDR upconverts it to a 433 MHz RF signal for transmission.
The lower path is the receive and demodulation chain: the same PlutoSDR receives the RF signal coupled through space. The complex-conjugate differential frequency discrimination algorithm is used for FM demodulation. The demodulated output signal passes through decimation downsampling, low-pass filtering and DC component removal, and is sent to the sound card to reconstruct the audio.
The flowgraph integrates multiple QT GUI observation components. It supports real-time viewing of the transmit baseband spectrum, received I/Q baseband spectrum, time-domain waveform of demodulated audio and audio spectrum. Online adjustment of audio gain is also available to complete the closed-loop test of WFM modulation and demodulation.
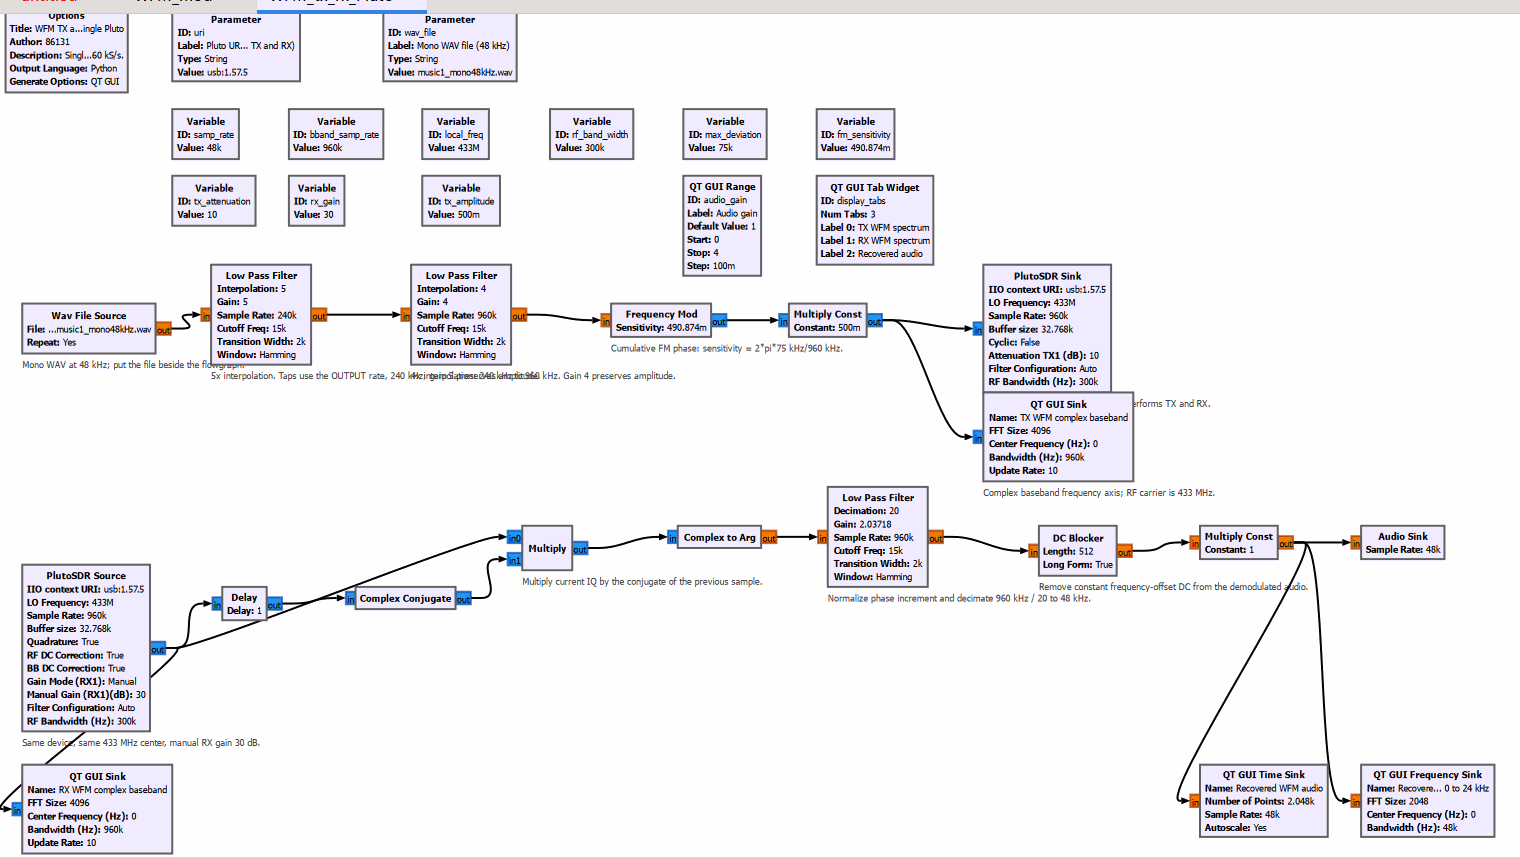
Click to run the flowgraph.
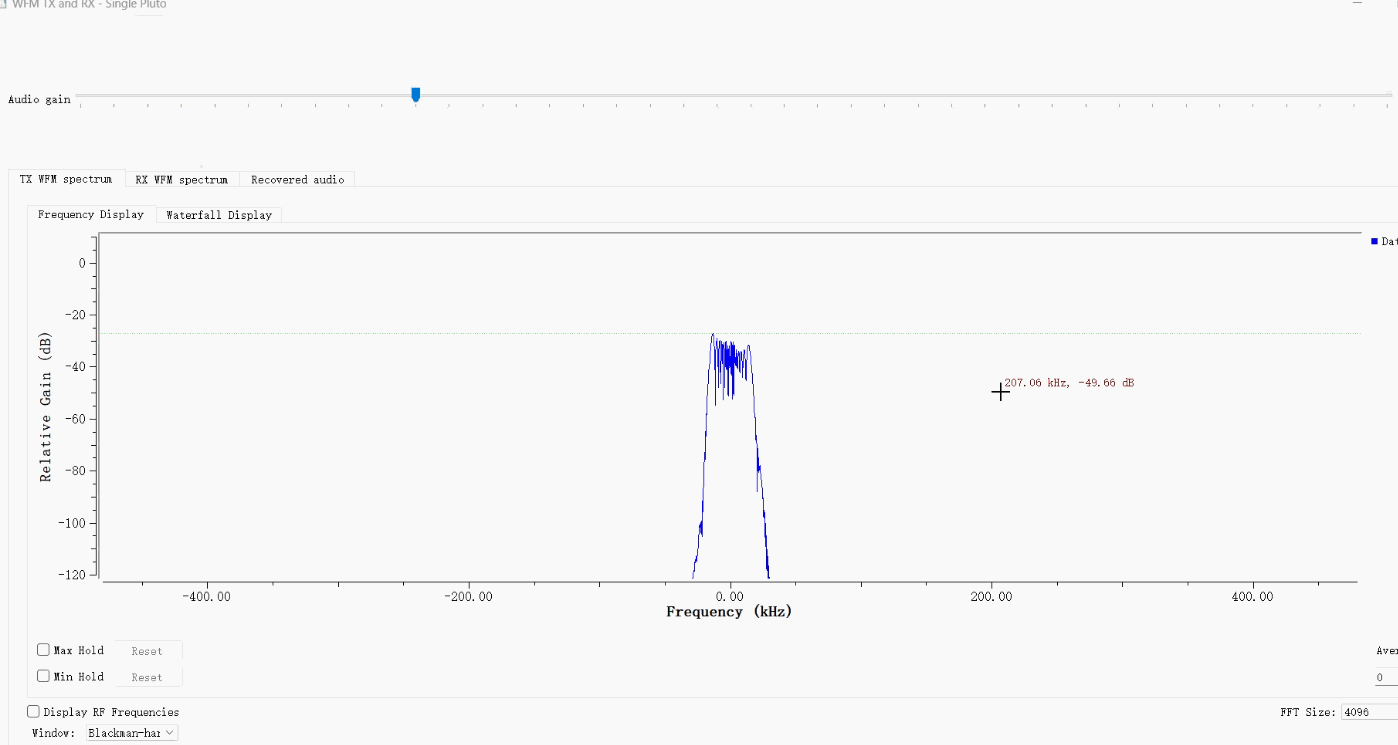
This figure shows the transmit baseband spectrum of the single PlutoSky P1 RF loopback WFM experiment. The WFM signal is centered at 0 kHz. The spectrum spreads outwards on both sides around the carrier, which matches the theoretical characteristics of wideband FM signals. The system noise floor is low and the profile of the modulated signal is clear, verifying proper WFM modulation in the transmit chain. The observation window uses the Blackman-Harris window function with 4096 FFT points for precise observation of the transmit baseband spectrum. The interface supports switching between transmit spectrum, receive spectrum and recovered audio views, as well as on-the-fly adjustment of audio gain. The audio signal transmitted from the transmitter can be heard successfully during the experiment.